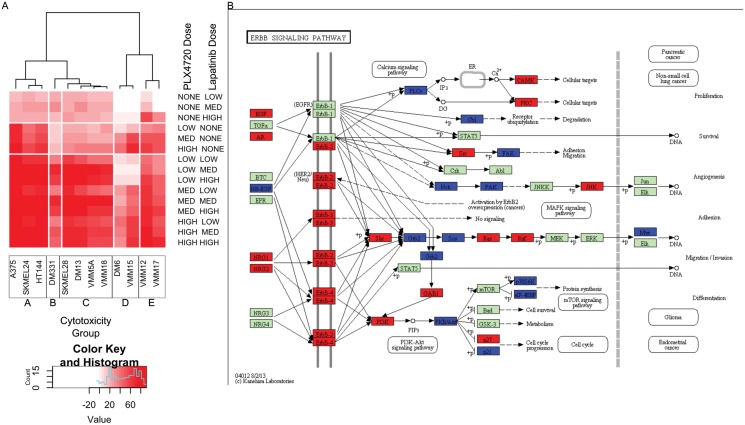
Fig 3. Clustering by cytotoxicity reveals differential responses to PLX4720 treatment.
Clustering of cell lines (x-axis) according to cytotoxic responses to PLX4720, lapatinib, and combination treatment at three doses for each individual drug and a three by three dose response for the combination (y-axis) (A). Five groups were identified: CGA (most left, 3 lines), CGB (near left, 1 line), CGC (center, 4 lines), CGD (near right, 2 lines), and CGE (far right, 2 lines). Pathway enrichment analysis of differential gene expression to PLX4720 treatment identified ERBB signaling as being broadly activated in CGC (B). Refer to S6 Table for fold change values used to generate pathway diagram.

