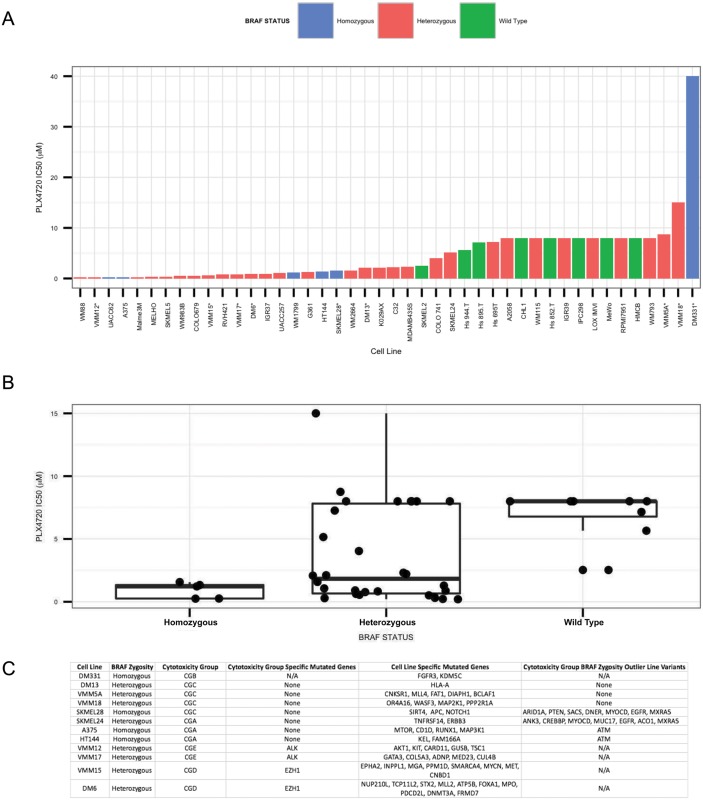
Fig 4. Exome analysis reveals trend between zygosity of V600E allele in the BRAF locus and sensitivity to PLX4720.
Ranked IC50 values for BRAF V600E melanomas from our panel and the CCLE. For lines in our panel that were also in the Cancer Cell Line Encyclopedia [26] (CCLE), we used the IC50 values from the CCLE. Lines from our panel are denoted with “*”. Zygosity at the BRAF locus was assayed using IGV visualization of BAM files. Lines found to be homozygous for the V600E allele were colored blue, lines found to be heterozygous for the V600E allele were colored red, and lines with only wild type BRAF were colored green (A). Box plots of IC50 values for BRAF V600E/V600E (Homozygous), BRAF WT/V600E (Heterzygous), and BRAF WT/WT (Wild Type), melanoma cell lines (B). Exome sequencing identifies potential causal variants. Variants present in our lines were compiled using exome sequencing and cross referenced with genes identified as being mutated across multiple cancer types [20]. BRAF zygosity, genes uniquely mutated in each drug cytotoxicity group, and the genes uniquely mutated in each line are listed (C).

