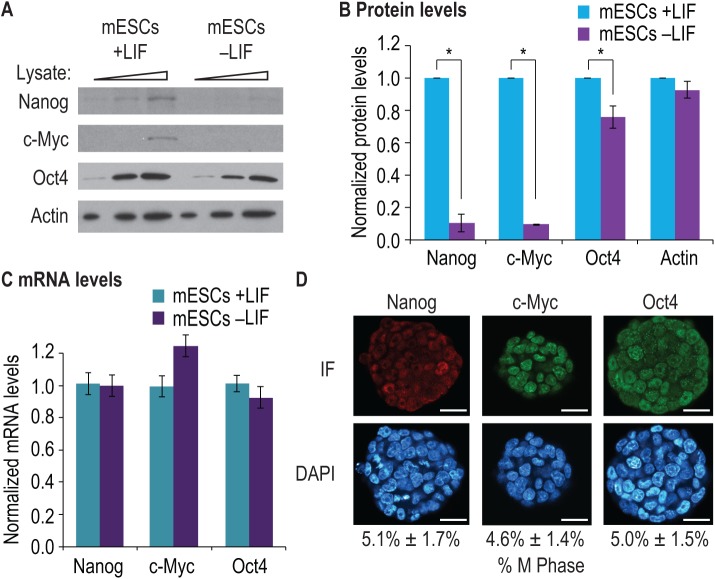
Fig 3. eIF2α phosphorylation correlates with Nanog and c-Myc expression.
(A) mESCs were cultured for 24 h either with LIF (mESCs +LIF) or without LIF (mESCs–LIF). Increasing amounts of cell lysate (indicated by triangles) were separated by SDS-PAGE and western blotted for indicated proteins. Nanog and c-Myc protein levels decreased after LIF withdrawal, whereas Oct4 levels were more modestly decreased when LIF was withdrawn. Actin served as a loading control. (B) Three biological replicates were prepared as in (A) and quantitated. Data were then normalized to values from mESCs grown with LIF. Error bars represent s.d. (*, p < 0.01 compared to mESCs +LIF samples). (C) RNA was prepared from mouse ESCs cultured as in (A) and RT-qPCR used to assay abundance of indicated RNAs. Loading was normalized to a control probe set (eEF1A mRNA). To provide relative mRNA abundance, data were normalized to mESCs grown with LIF. Nanog, c-Myc and Oct4 mRNA levels were unaltered in mESCs grown with or without LIF. Error bars represent s.d. (D) Mouse ESCs were cultured with LIF and BMP4. Colonies were then fixed and stained for the indicated proteins (IF samples); DAPI staining was used to visualize nuclear DNA. Nanog, c-Myc and Oct4 proteins were detectable in all cells within a colony. Mouse ESC cell divisions were confirmed by counting and calculating the percentage of cells in M phase for each sample, as shown below each representative colony. Scale bars: 50 μm. Three separate mESC cultures were used to quantitate M phase cells (s.d. shown).

