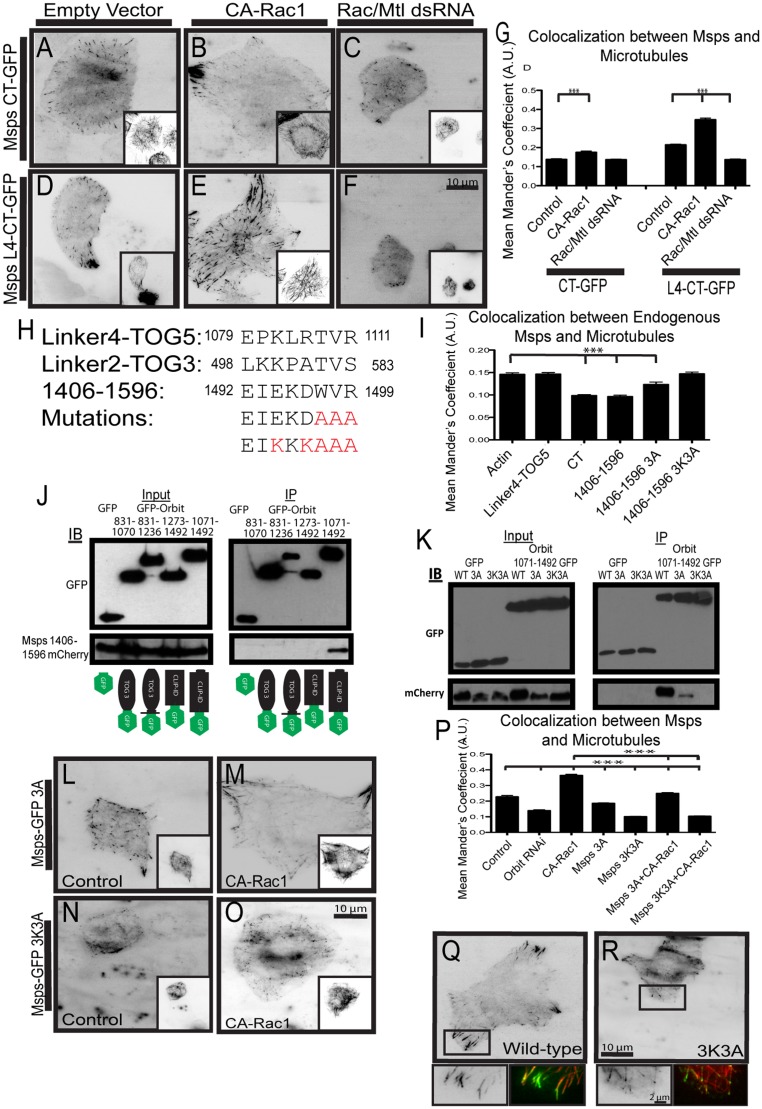
Fig 5. Msps 1406–1506 interacts with Orbit.
(A-C) MspsCT-GFP was expressed in cells with a dual expression vector containing tRFP-α-tubulin alone (A) or with CA-Rac1 (B) and also in cells with Rac1/Rac2/Mtl depletion (C). (D-F) Msps L4-CT-GFP was expressed in cells with a dual expression vector containing α-tubulin-tRFP alone (D) or with CA-Rac1 (E) and also in cells with Rac1/Rac2/Mtl depletion (F). Tubulin images are shown as insets. (G) Changes in co-localization of Msps were measured using the Mander’s coefficient, n = 90 cells from three experiments. *** p<0.0001 (H) Alignment of sequences contained in Msps Linker4-TOG5, Linker2-TOG3 and 1406–1596, residue number is indicated to the right and left of the residue. (I) Changes in co-localization of endogenous Msps and microtubules due to competition with Msps C-terminal and mutant fragments, n = 90 cells from two experiments. *** p<0.0001 (J) mCherry-tagged Msps 1406–1596 coimmunoprecipitates with C-terminal Orbit residues 1071–1492. (K) mCherry-tagged Msps 1406–1596 mutants fail to coimmunoprecipitate with C-terminal Orbit residues 1071–1492. (L-M) Msps-GFP 3A was expressed in cells with a dual expression vector containing tRFP-α-tubulin alone (L) or with CA-Rac1 (M). (N-O) Msps-GFP 3K3A was expressed in cells with a dual expression vector containing tRFP-α-tubulin alone (N) or with CA-Rac1 (O). Tubulin images are shown as insets. (P) Co-localization between Msps and microtubules were measured using the Mander’s coefficient, n = 90 cells from three experiments. *** p<0.0001 (Q) Localization of wild-type Msps, insets represented with a rectangle highlighting the periphery. (R) Localization of Msps 3K3A, insets represented with a rectangle highlighting the periphery.

