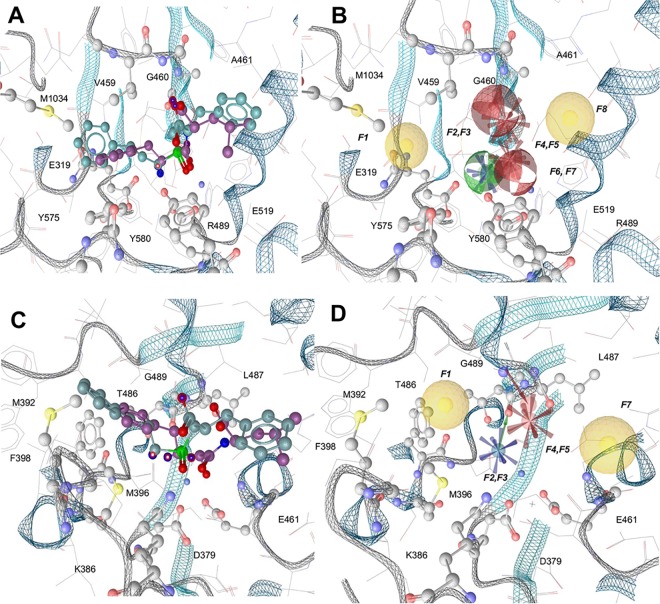
Fig 1. Pharmacophore hypotheses for PfA-M1 and PfA-M17.
Protein backbone is shown as grey (loops) and cyan (strands and helices) ribbons. The residues interacting with the pharmacophore maps are represented as ball and sticks, and colored by atom type. Bestatin is represented in violet, while hPheP[CH2]Phe is in cyan. A) Superposition of bestatin and hPheP[CH2]Phe in the PfA-M1 active site. B) PfA-M1 obtained shared pharmacophore map, which consists of the following features: F1 and F8 hydrophobic features, F2 hydrogen bond donor feature, F3 positively charged feature, F4 and F7 hydrogen bond acceptor features, F5 and F6 negatively charged features. C) Superposition of bestatin and hPheP[CH2]Phe in the PfA-M17 active site. D) PfA-M17 obtained shared pharmacophore map, which consists of the following features: F1 and F6 hydrophobic features, F2 positively charged feature, F3 hydrogen bond donor feature, F4 negatively charged feature, F5 hydrogen bond acceptor feature.

