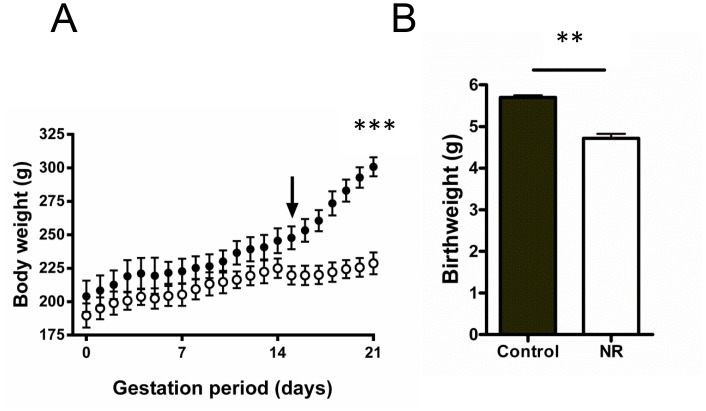
Fig 2. Maternal weight gain during pregnancy and subsequent birth weight of pups.
(A) Maternal weight gain is shown for both Control (●, n = 5) and nutrient restricted (○, n = 5) groups over the course of gestation. Nutrient restriction was induced at day 14 (downward arrow) until parturition at day 21. All data are mean ± SEM. (Student’s t-test, ***P <0.001). (B) Mean birth weight (+SEM) for Control (n = 51) and nutrient restricted (n = 52) pups. Nutrient restricted pups were found to be significantly smaller than controls (ANCOVA, C: 5.61 g ± 0.05 Vs. NR: 4.59 g ± 0.07; F (1, 8) = 15.724, **P < 0.01). Nested model analysis suggested a large grouping effect associated with the intrauterine environment from which litters of pups were derived (ANCOVA, F (8, 93) = 17.193, **P < 0.01). Birth weight distribution of control pups indicated a lower 10th percentile of 5.1 g, with > 80% of NR pups falling below this weight.

