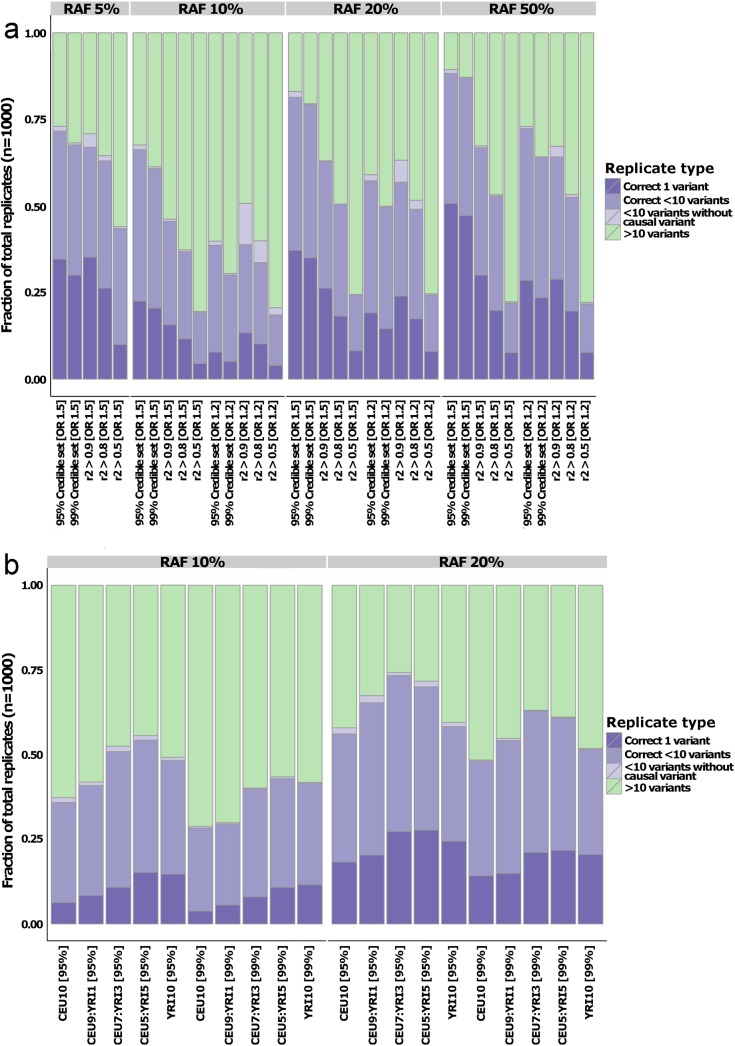
Fig 3. Quantifying fine-mapping success.
Fraction of the simulations where the fine-mapped set is reduced to fewer than 10 variants for the comparison with r2-derived sets (a) and multi-ethnic study designs (b). Colors denote whether the set contains the causal variants and only one variant (dark purple), causal variant and fewer than 10 variants (medium purple), fewer than 10 variants but not the causal variant (light purple), or more than 10 variants (green). In both panels, the data is split by risk allele frequency (RAF) on the horizontal plane. Panel (a) is grouped by odds ratio (OR) on the x-axis, whereas the OR was set to 1.2 in all the multi-ethnic simulations.

