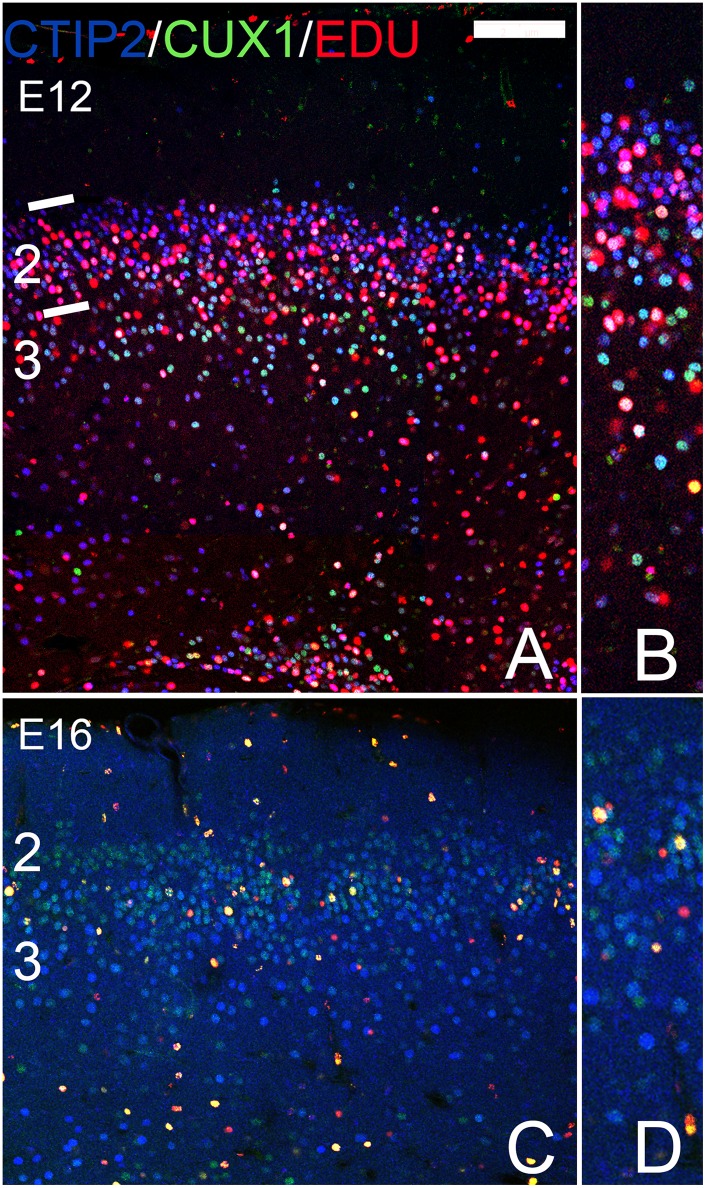
Fig 10. Patterns of staining in the PPC of mice that receiving the mitotic marker EDU either on E12 (A,B) or E16 (C,D).
Panels B and D provide higher power views of the cellular regions of the figures to their left. The E12 injection labeled many CTIP2 cells (CTIP2+EDU depicted as pink) in layer 3 and in the deep portion of Layer 2. Relatively few CUX1 +EDU (yellow) or CUX1/CTIP2+EDU (white) were observed. Scattered labelled cells were seen in layer 2 after EDU injection on E16; most were CUX1+EDU (yellow) positive. Numbers and lines on the left margin of A and C delineate cortical layers. Scale bar = 200μm.

