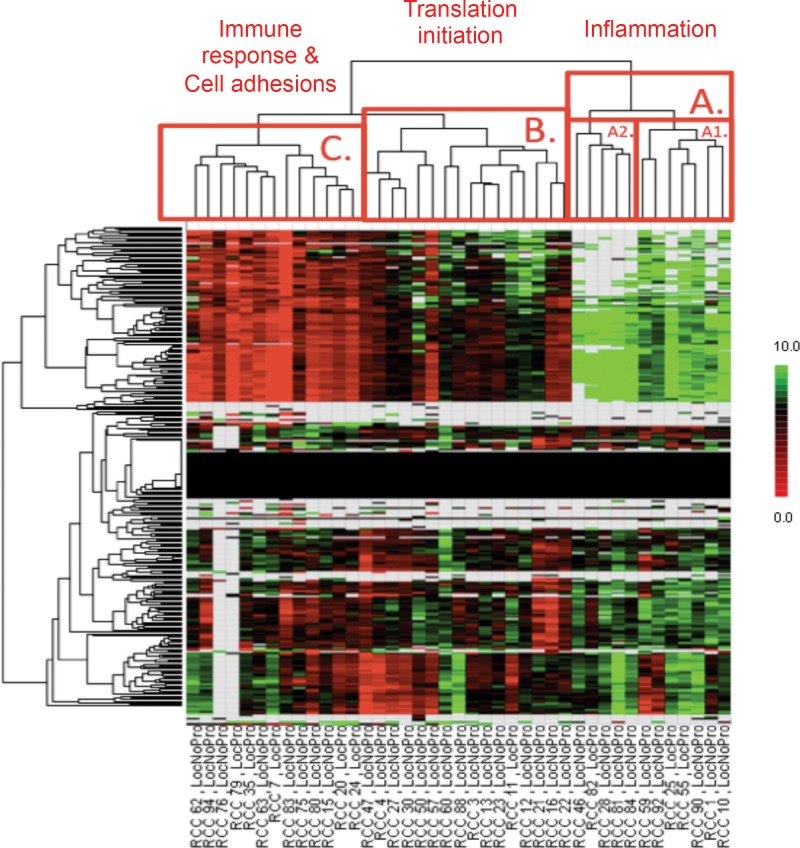
Fig 2. Unsupervised hierarchical clustering of kinomic profiles among localized CC-RCC.
Unsupervised hierarchical clustering of kinomic peptide phosphorylation signal intensity (Y-axis) show three predominant cluster groups (labeled A, B and C on the dendrogram) among the 41 CC-RCC tumors. GeneGo MetaCore Process mapping of the significantly different peptides (p<0.002) among the clusters was performed and the dominant pathway for each cluster is indicated. Tumor number (RCC X) and clinical outcome is indicated on the X-axis (LocNoPro = locally controlled; LocPro = local progressor). Log fold changes as a deviation from the mean are displayed in the heatmap.

