Figure 6.
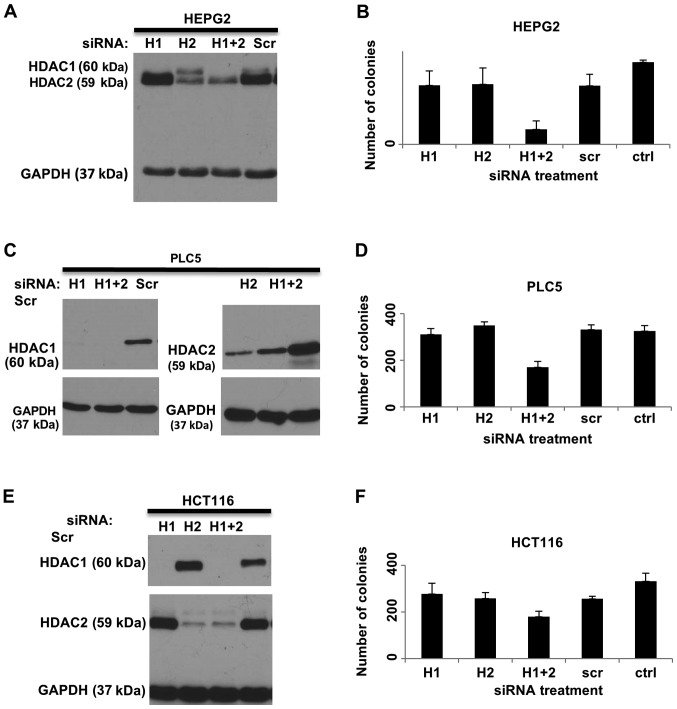
HDAC1 and/or HDAC2 knockdown. Western blot analysis shows the knockdown of protein expression of HDAC1 and/or HDAC2 in (A) HEPG2, (C) PLC5 and (E) HCT116 cells. Cells were transfected with HDAC1 siRNA (H1) or HDAC2 siRNA (H2), or both (H1+2), or non-silencing control siRNA (Scr). After 72 h, cells were harvested for protein, and western blot analysis using HDAC1- and HDAC2-specific antibodies was carried out. GAPDH was used as a loading control. Quantification of colony formation in (B) HEPG2, (D) PLC5 and (F) HCT116 after HDAC1 and/or HDAC2 were knocked down in the cells. The average number of colonies in each of the triplicate wells was plotted against the treatment. Error bars showed standard deviations. The knockdown of both HDAC1 and HDAC2 together was required to reduce colony formation. HDAC, histone deacetylase.

