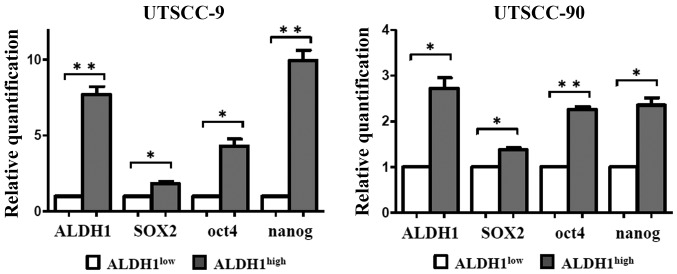
Figure 2.
Expression of stem cell markers in ALDH1high and ALDH1low cells. mRNA purified from UTSCC-9 and UTSCC-90 cells were analyzed by real-time PCR. mRNA expression of stem cell markers including ALDH1, SOX2, Nanog and Oct4 were compared between ALDH1low and ALDH1high cells. The horizontal bars represent the mean expression levels. Error bars represent SD; *P<0.05, **P<0.01, by paired t-test.

