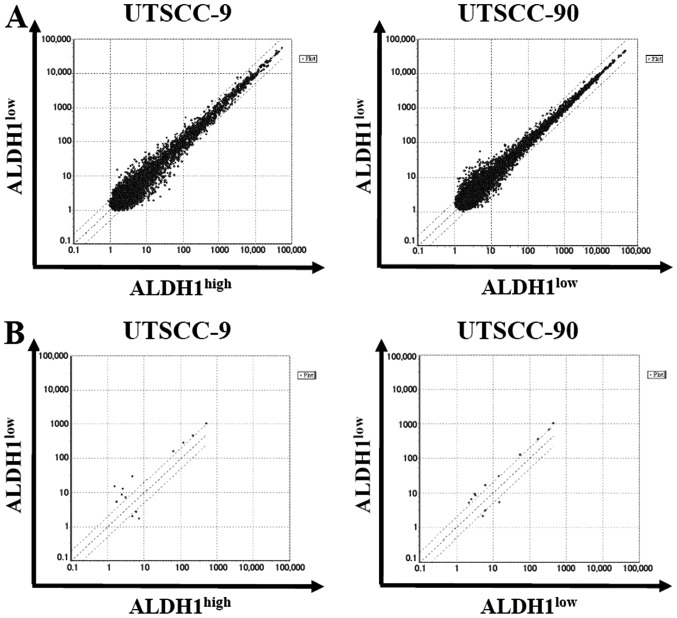
Figure 5.
microRNA expression profiles in UTSCC-9 and UTSCC-90. (A) Scatter plot representation of whole mature miRNAs between ALDH1high (x-axis) vs ALDH1low cells (y-axis). (B) Scatter plot representation of differentially expressed miRNAs according to threshold of ≥2-fold difference between ALDH1high (x-axis) vs ALDH1low cells (y-axis).

