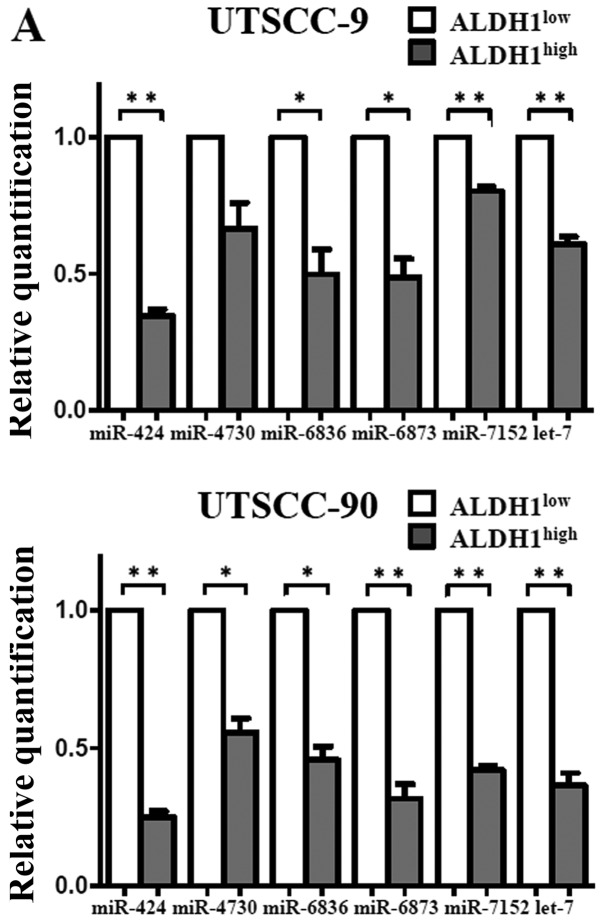
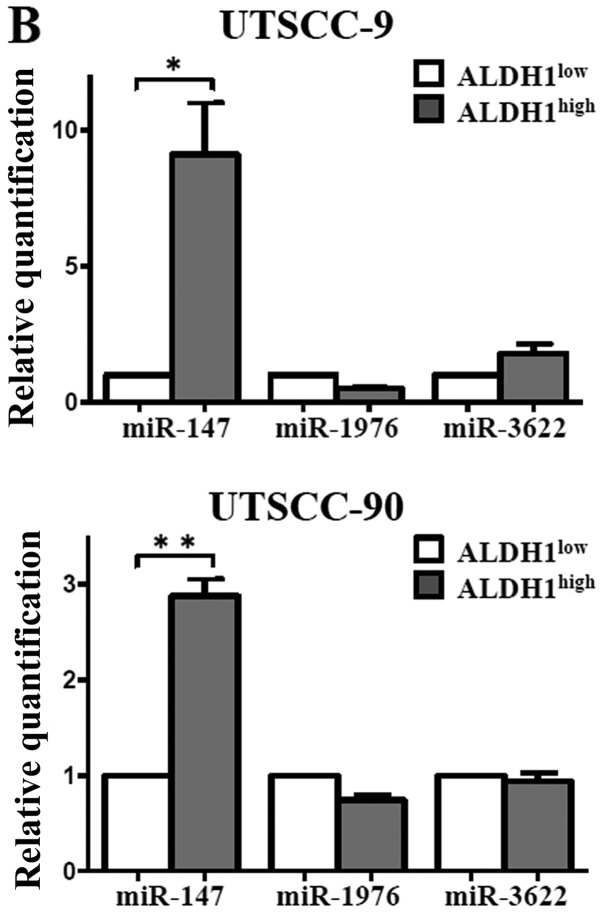
Figure 6.
Real-time PCR analysis of microRNAs differentially expressed in microarray analysis. (A) Upregulated miRNAs in ALDH1high compared to ALDH1low cells: miR-424, let-7a, miR-4730, miR-6836, miR-6873 and miR-7152. (B) Downregulated miRNAs in ALDH1high compared to ALDH1low cells. The horizontal bars represent the mean expression levels; *P<0.05, **P<0.01, by paired t-test.


