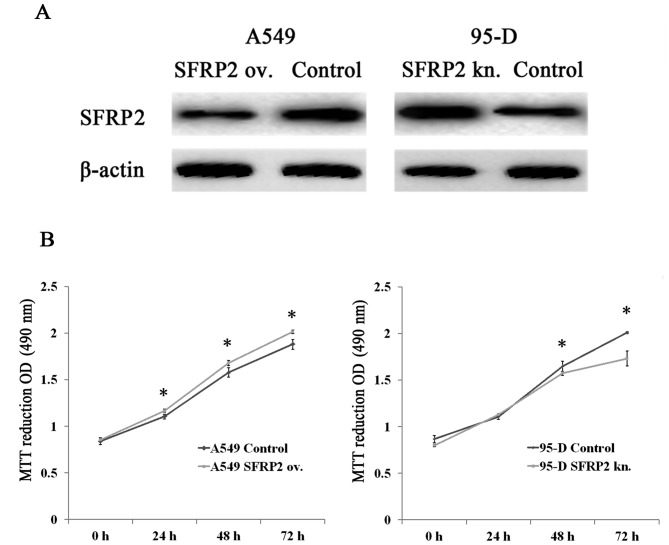
Figure 2.
The influence of SFRP2 on the proliferation in lung cancer cells. (A) Representative images for SFRP2 protein detection in SFRP2-overexpressing A549 cells (left panel) and SFRP2-knockdown 95-D cells (right panel). (B) The OD490 values in A549 cells with SFRP2 overexpression (left panel) and 95-D cells with SFRP2-knockdown (right panel), along with their respective controls at 24h, 48h and 72h after transfection by MTT assays. ov. and kn. represent overexpression and knockdown, respectively. Data are presented as mean ± SD. Statistical significance was evaluated using the Student's t-test. *P-value <0.05.

