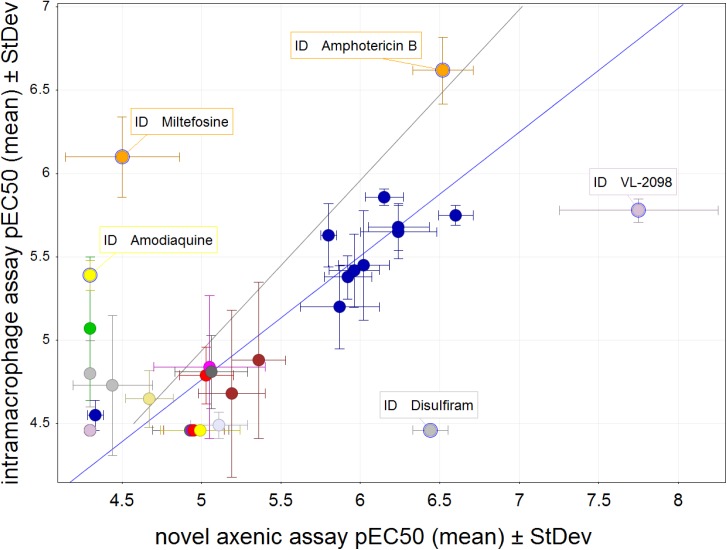
Fig 3. Potency comparison of a series of structurally distinct compounds between the novel axenic and intramacrophage assay.
In this scatterplot the mean pEC50 values for control compounds representing a range of pharmacophores are compared between the novel and intramacrophage assay. Data set represents three or more replicates and the standard deviation is shown with error bars for each assay. Black line shows equipotency between both assays, blue line shows linear regression for compounds that are active in both assay (with outliers miltefosine and VL-2098 excluded, R2 = 0.81).

