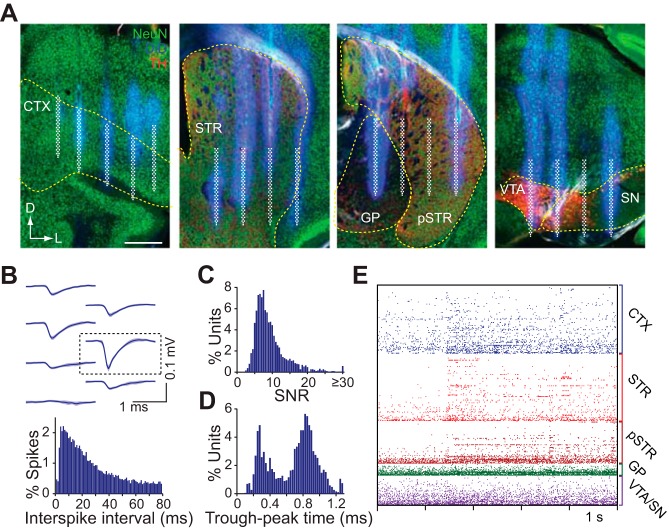
Fig. 2.
Histology and single-unit characteristics. A: confocal microscope images of the coronal brain sections from four simultaneously targeted areas. The DiD fluorescence signals indicate the silicon prong insertion sites, from which the electrode positions were reconstructed. The approximate location of the electrode arrays are superimposed in white. Sections are colabeled with antibodies against NeuN and tyrosine hydroxylase. Dashed lines indicate boundaries of the regions of interest. Scale bar represents 0.5 mm. B, top: representative mean spike waveform of a putative cortical unit on a local cluster of electrodes. The boxed area corresponds to the electrode where the unit is approximately located. B, bottom: interspike interval distribution for the above unit. C: signal-to-noise (SNR) distribution of all putative single units from 6 recording sessions. D: bimodal spike width (trough-to-peak time) distribution of all putative single-units. E: activity raster of 308 (95 orbitofrontal, 155 striatal, 17 pallidal, and 41 VTA/SN) simultaneously recorded units from 1 animal during an olfactory stimulus presentation.

