Fig. 4.
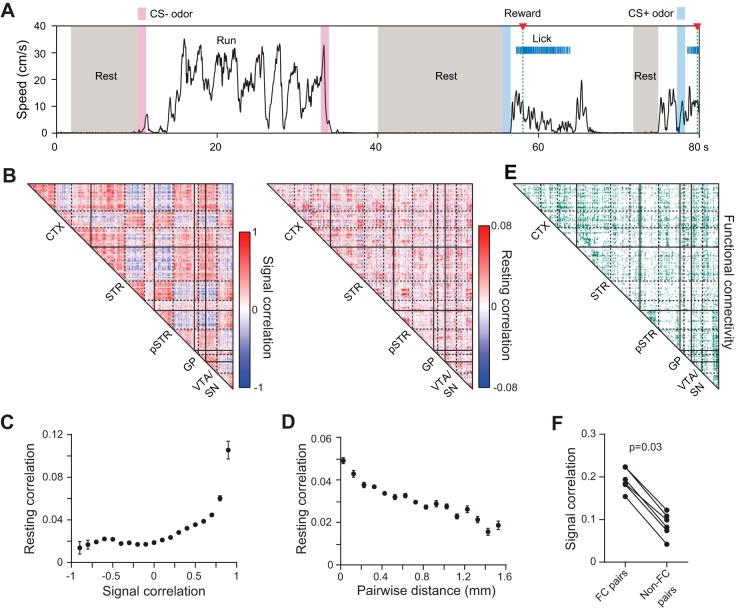
Large-scale analysis of network correlations. A: example of resting state intervals corresponding to idle periods during behavioral testing. B, left: signal correlation (rsignal) matrix for mean task-evoked activity during CS+ trials. Data represent simultaneously recorded units from 1 animal. Matrix elements were arranged by independent k-means clustering in each of the anatomical areas indicated. Three clusters were assigned to the cortex and striatum, and the other areas were assigned two clusters. Solid lines demarcate the brain areas where k-means clustering took place separately. Dashed lines indicate the cluster boundaries within each area. B, right: resting correlation (rrest) matrix using the cell ordering identified from k-means clustering of the signal correlations. The matrices are correlated (r = 0.1, P < 0.0001, permutation test for correlations). C: mean resting state correlation coefficient as a function of signal correlation during correct CS+ trials. Individual rrest and rsignal values are correlated (r = 0.1, P < 0.0001, permutation test for correlations). Data are combined from all simultaneously recorded cell pairs in 6 animals. Points denote binned means ± SE. D: mean resting state correlation coefficient as a function of pairwise distance between units located in the same brain region. Data are combined from all simultaneously recorded cell pairs in 6 animals. Points denote means ± SE binned in increments of 0.1 mm. E: matrix identifying pairs of simultaneously recorded cells with a significant resting state correlation, considered a functional connection. The cell ordering was identified from k-means clustering of the corresponding signal correlations in B. F: the signal correlation during correct CS+ trials is higher between functionally connected (FC) cells. Points denote the mean signal correlation coefficient between all functionally connected or unconnected pairs per animal.

