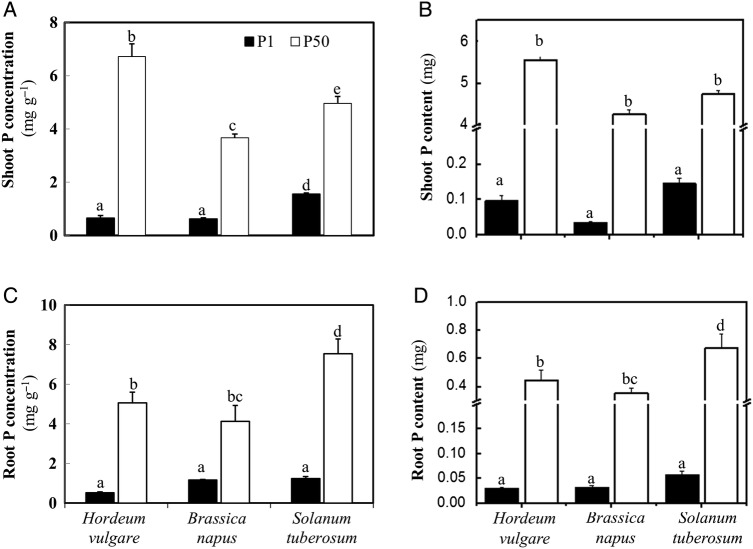
Figure 5.
(A) Phosphorus concentration in shoot tissue, (B) P content in shoot tissue, (C) P concentration in root tissue and (D) P content in root tissue of H. vulgare, B. napus and S. tuberosum grown in nutrient solution at two levels of P supply (P1 = 1 μM P, P50 = 50 μM P). Plants were harvested after 28 days growth. Values are means ± SE of n = 6–7. Different letters indicate significant differences (P < 0.05) as shown by Tukey tests.

