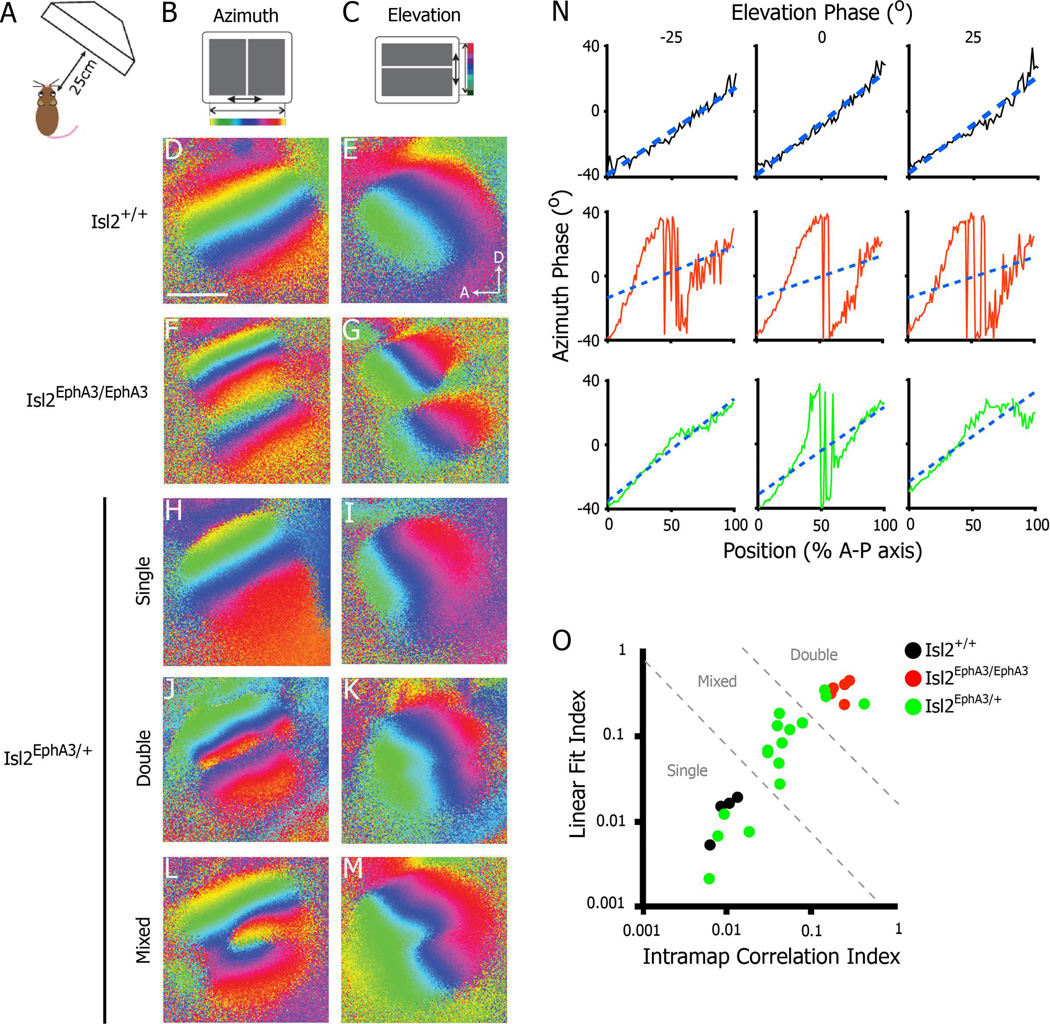
Figure 1.
Heterogeneity in the functional azimuth representation in the SC of Isl2EphA3/+ mice. A–C) Schematics of intrinsic signal optical imaging paradigm. Drifting vertical (azimuth, B) and horizontal (elevation, C) are presented on a screen placed 25 cm from an anesthetized mouse. Regions of the SC responding to different regions of the visual field are pseudo-colored as indicated. D-E) Azimuth (D) and elevation (E) representations in a wild type SC reveal a single coherent map in each case (n = 4). F–G) Imaging of SC responses in an Isl2EphA3/EphA3 mouse reveal a complete duplication of azimuth (F) and a discontinuity at the border of these maps in the elevation representation (G) (n = 5). H-M) Imaging of SC responses in an Isl2EphA3/+ reveals a variety of organizations in the azimuth representations: single (H), double (J) and mixed-type (L) (n = 16). N) Phase plots of the azimuth representation along the anterior-posterior axis of the SC at three isoelevation points from Isl2EphA3/+ mice exhibiting a single map organization (top row), double organization (middle row) and mixed organization (bottom row). Blue dashed lines represent the best linear fit for each phase plot. O) Map organizations plotted by two quantitative indices. Isl2+/+ maps (black dots) fall within the region determined to be single, Isl2EphA3/EphA3 maps (red dots) fall within the double zone, and Isl2EphA3/+ maps (green dots) are distributed across single, double and mixed regions of the plot. bar, 0.5 mm; A, anterior; D, dorsal

