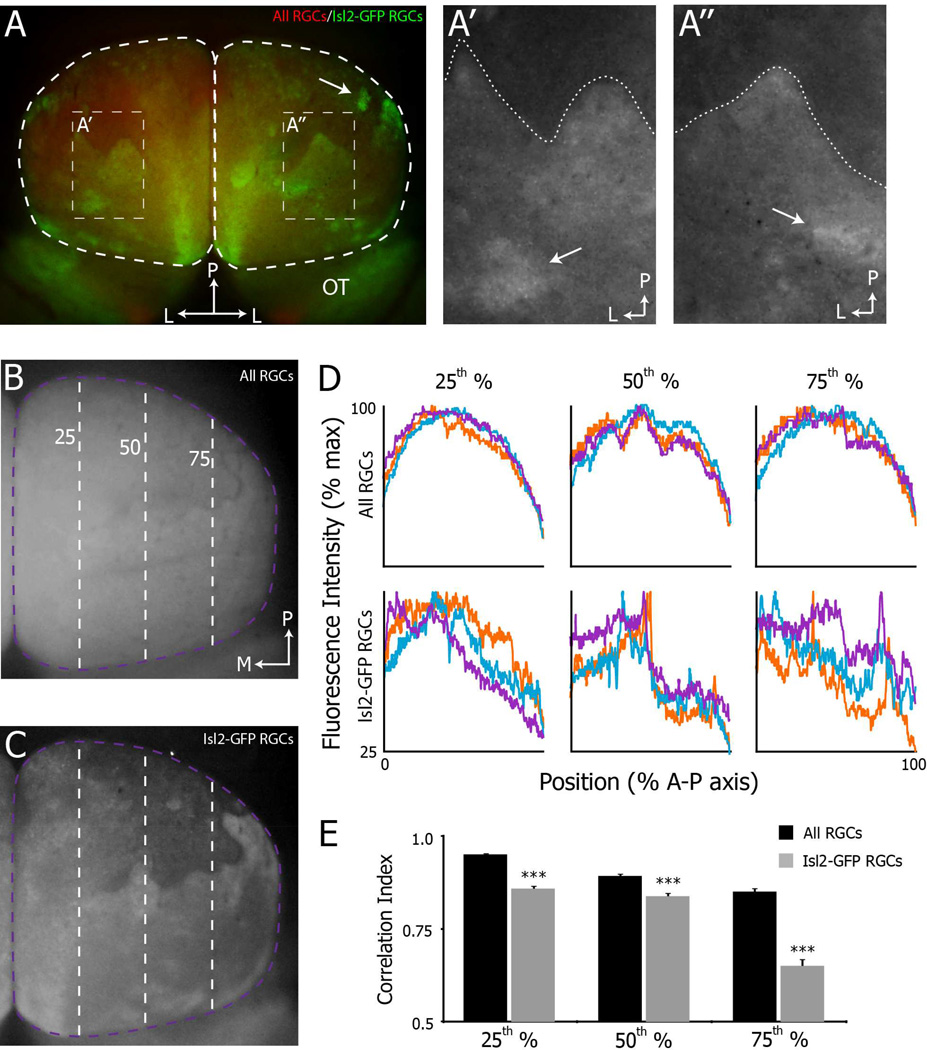
Figure 4.
Heterogeneity in the projection patterns of Isl2+ RGCs in Isl2EphA3/+ mice. A) Dorsal views of Isl2-GFP projections to the SC (white dashed regions) in whole mount of an adult Isl2EphA3/+ mice reveal distinct organizations. A’-A”) Enlarged views of regions of interest indicated in (A). Dashed lines indicate the “border” between regions of high and low Isl2-GFP+ RGC innervation. Arrows indicate clusters of Isl2-GFP+ RGC terminals. B & C) Dorsal views of the projections of all RGCs (B) and Isl2-GFP+ RGCs (C) to the left SC of an adult Isl2EphA3/+ mouse. Dashed purple and green lines are located at the 25th, 50th and 75th percentile of the medial-lateral axis of the SC. D) Plots of the fluorescence intensity signal of all RGCs (top row) and Isl2-GFP+ RGCs (bottom row) from three representative Isl2EphA3/+ SCs. Intensity was plotted as a function of position along the A-P axis at three different parasagittal planes of the M-L axis, indicated by dashed lines in (B & C). E) Quantification of the average correlation indices at each parasagittal plane for all RGCs (black bars, n = 8) and Isl2-GFP RGCs (grey bars, n = 11). bar, 0.5 mm; L, lateral; P, posterior; OT, optic tract; M, medial; A, anterior; **, p < 0.01 vs. All RGCs; ***, p < 0.001 vs. All RGCs

