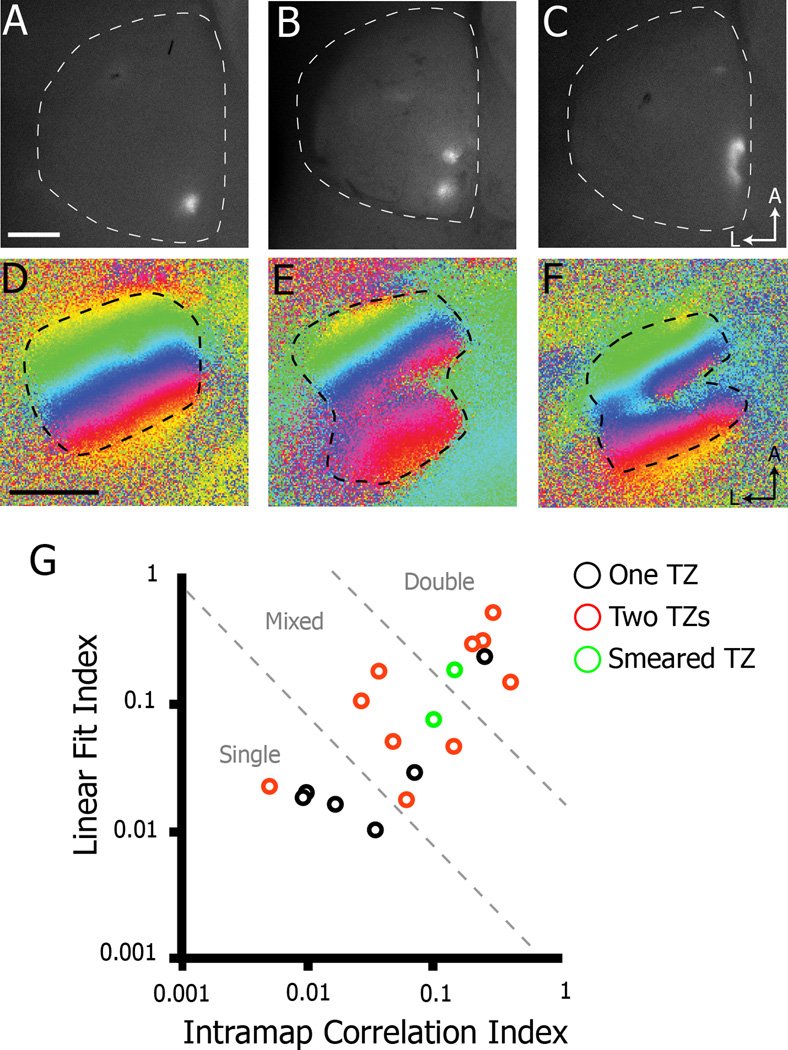
Figure 5.
Correlation of anatomical and functional map organizations in Isl2EphA3/+ mice. A–C) Dorsal views of the SCs of Isl2EphA3/+ mice in which the nasal retina was focally labeled with DiI reveals one (A), two (B), or a smeared (C) termination zone (TZ) (n = 18). D–E) Corresponding functional representations of azimuth to the Isl2EphA3/+ mice labeled in A–C. G) Map organizations of traced and imaged Isl2EphA3/+ SCs plotted by two quantitative indices. Axon labeling resulting in one (black circles), two (red circles) or smeared (green circles) TZs is indicated. bar, 0.5 mm; A, anterior; L, lateral

