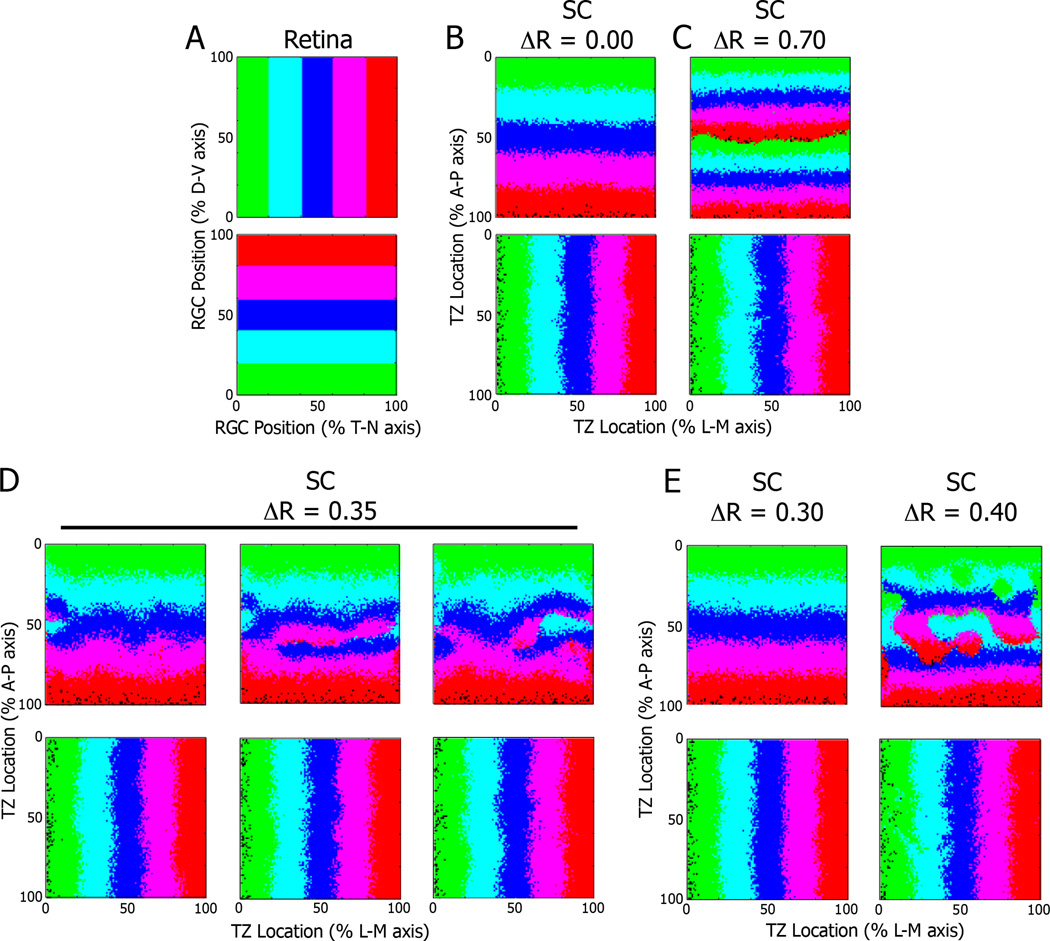
Figure 7.
Replication of heterogeneity in a mathematical model of retinocollicular mapping. A) Representations of the retina as a 100 × 100 matrix, with corresponding color-coding based on position along the D–V and T–N axes. B) Results of simulations of the model run with the value for exogenous EphA3 expression (ΔR) set to 0.00 (for wild type) or 0.70 (for Isl2EphA3/EphA3) reveal predicted organizations of projections along the A-P and L-M axes of the SC. D) Representative examples of three distinct simulations of the model when ΔR was set to 0.35 (for Isl2EphA3/+ mice), reveals a heterogeneity in the organization of inputs along the A-P axis. Minor changes in ΔR around 0.35 yielded consistent map organizations that were singular (0.30) or doubled (0.40). D, dorsal; V, ventral; T, temporal; N, nasal; A, anterior; P, posterior; L, lateral; M, medial

