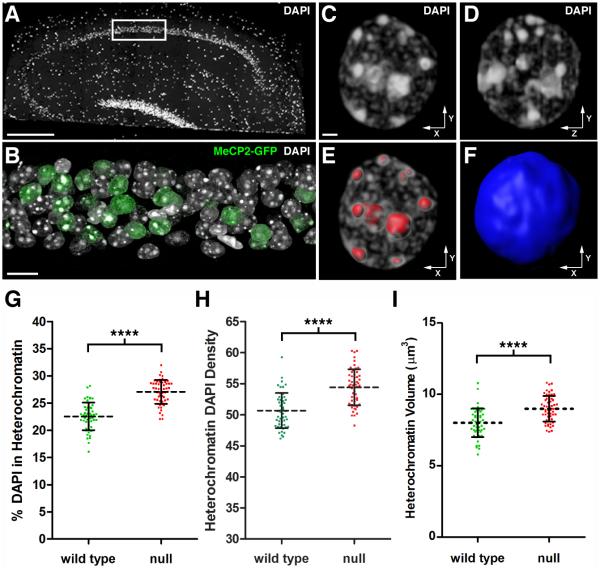
Figure 1. Quantitative Analysis of Chromatin Architecture In Hippocampal Pyramidal Neurons.
(A) DAPI stained nuclei in a 200 nm hippocampal section from a symptomatic female RTT mouse (Mecp2-egfpB./+). The image was stitched from multiple fields acquired using a 25X objective. Scale bar, 100 μm. The white rectangle encloses the portion of the CA1 pyramidal cell layer used for high-resolution imaging. (B) Volume rendering of 59 serial sections (200 nm thick) through the hippocampal pyramidal cell layer. DAPI labels nuclei, and an antibody to GFP was used to identify cells expressing MeCP2-GFP. Note mosaic expression of Mecp2-egfp gene due to random Xi. Scale bar, 10 μm. (C-F) Nucleus from a WT pyramidal neuron. (C) Volume rendering of the nucleus viewed along the x-y axis. Scale bar, 1 μm. (D) Nucleus viewed along the y-z axis. (E) 3D surfaces (red) used to isolate heterochromatin for quantification. (F) A single 3D surface (blue) encloses the entire contents of the nucleus. (G-I) Analysis of WT and Mecp2-null pyramidal neurons. (G) Scatter plot showing the percentage of total nuclear DAPI pixel intensity located within the heterochromatin threshold (mean ± SD). (WT, 22.5 ± 2.5 %, n = 51 nuclei from 3 mice), (null, 27.1 ± 2.2 %, n = 55 nuclei from 3 mice). Unpaired t test, p < 0.0001. Xi chromosome values were subtracted from total heterochromatin. (H) Scatter plot showing the density of DAPI pixel intensity within the heterochromatin threshold (mean ± SD). Density is expressed as pixel intensity (×103) per μm3. (WT, 50.7 ± 2.8), (null, 54.4 ± 2.9). Unpaired t test, p < 0.0001. (I) Scatter plot showing heterochromatin volume (mean ± SD). (WT, 8.0 ± 1.0 μm3), (null, 9.0 ± 0.9 μm3). Unpaired t test, p < 0.0001. See also Figure S1 and Movie S1.

