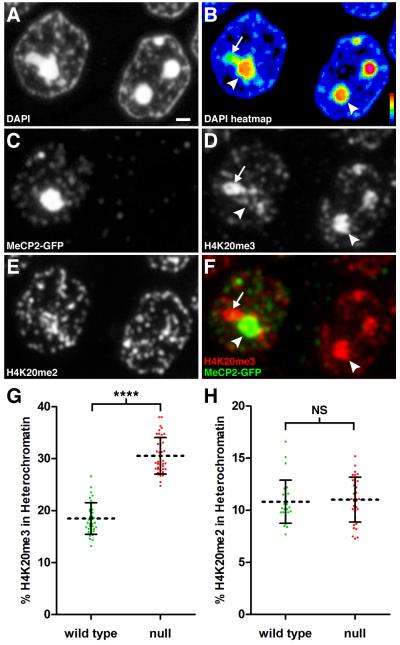
Figure 3. The H4K20me3 Modification is Redistributed Spatially Upon Loss of MeCP2.
Panels A-F represent fluorescence images acquired using the same 200 nm section through the hippocampal pyramidal cell layer. (A) DAPI staining. Scale bar, 1 μm. (B) Relative pixel intensity of DAPI staining. Heat map index is located in the lower right corner. Arrow indicates lower intensity heterochromatin still within threshold value. Arrowhead points to high intensity heterochromatin. (C) Immunostaining for MeCP2-GFP. Left, WT nucleus; Right, Mecp2-null nucleus. (D) Immunostaining for H4K20me3. Arrows and arrowhead as in Fig. 3B. (E) Immunostaining for H4K20me2. (F) Merged image for MeCP2-GFP and H4K20me3. In the WT nucleus, MeCP2-GFP binding dominates in pericentromeric heterochromatin (arrowhead) while H4K20me3 localizes to the heterochromatin region with lower DAPI density (arrow). (G) Scatter plot showing percentage of total nuclear H4K20me3 within heterochromatin in pyramidal neurons (mean ± SD). There is a significant redistribution of H4K20me3 into heterochromatin after loss of MeCP2 (WT, 18.5 ± 3.0, n = 36 nuclei from 3 mice), (null, 30.5 ± 3.5, n = 41 nuclei from three mice). Unpaired t test, p < 0.0001. (H) Scatter plot showing the percentage of total nuclear H4K20me2 within heterochromatin (mean ± SD) for pyramidal neurons. (WT, 10.8 ± 2.1, n = 27 nuclei from 2 mice), (null, 11.0 ± 2.2, n = 31 nuclei from two mice). Unpaired t test, p = 0.72. See also Figure S2, Figure S3, and Movie S3.

