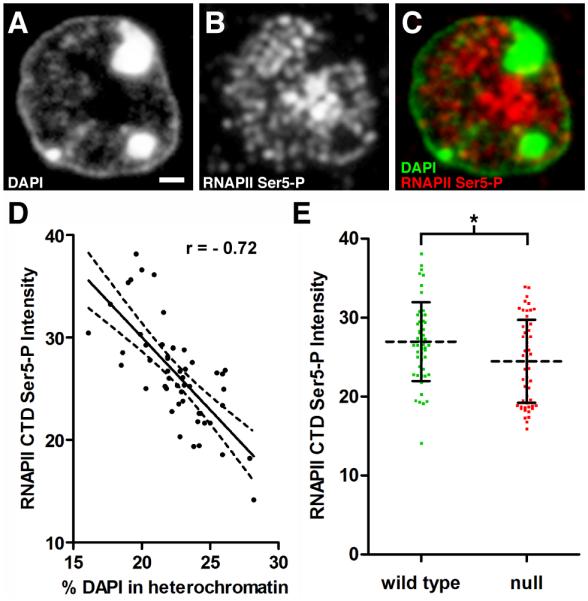
Figure 6. AT Analysis of Transcriptional Activity.

Panels A-C represent fluorescence images acquired using the same 200 nm section through a pyramidal neuron. (A) DAPI staining. Scale bar, 1 μm. (B) Immunostaining with antibodies directed against the phosphorylated CTD (Ser5) of RNA polymerase II (RNAPII Ser5-P) to detect the active polymerase. (C) Merged image of DAPI and RNAPII Ser5-P. Note that RNAPII Ser5-P is excluded from heterochromatic foci. (D) Total integrated pixel intensity (×105) for RNAPII Ser5-P from WT nuclei was plotted versus heterochromatin content. RNAPII Ser5-P levels are negatively correlated with increasing heterochromatin content (n = 51 nuclei from 3 mice, Pearson r = − 0.72, p < 0.0001). (E) Scatter plot comparing RNAPII Ser5-P levels in WT and Mecp2-null pyramidal neurons. Intensity units represent total integrated pixel intensity (×105) with mean intensity normalized for WT pyramidal neurons. (WT, 27.0 ± 5.0, n = 51 nuclei from 3 animals), (null, 24.5 ± 5.2, n = 55 nuclei from three animals). Unpaired t test, p = 0.013.
