
Figure 5. Extensive Proliferative and Neurogenic Capacity of oRG Cells.
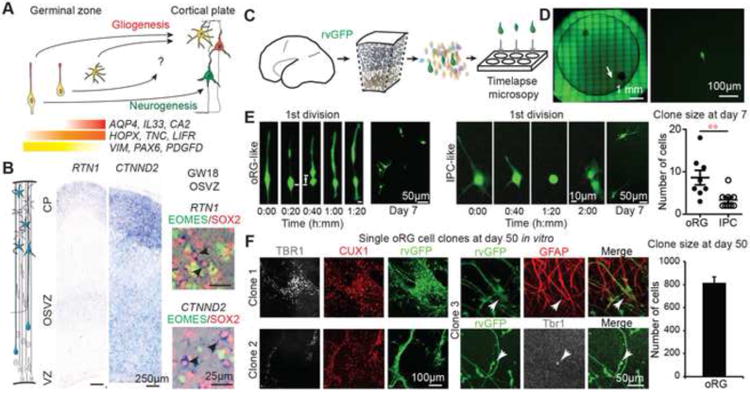
(A) Schema representing progenitor cell competence of radial glia, oRG cells and glial progenitors (See also Figure S5). (B) In situ hybridization for genes expressed by oRG and other cell types but depleted in vRG cells and immunolabelling of GW18 human cortical sections (see also Figure S6). Black arrows indicate examples of mRNA expressing oRG cells. (C) Experimental design for single cell clonal lineage analysis of oRG cells labeled with retrovirus GFP (rvGFP). (D) Image and magnification of a well containing a single purified GFP-positive cell. Timelapse imaging of single cell with arrow highlighting MST preceding first division. (E) Images show movie frames capturing the initial division and a resulting clone after 7 days in culture of a cell exhibiting oRG specific mitotic somal translocation (left) and a cell undergoing an initial stationary division with fiber retraction characteristic of intermediate progenitors and a resulting clone after 7 days in culture (right). Chart shows clone sizes at 7 days for cells classified as oRGs and IPCs based on first division and morphology. (F) Immunostaining for neuronal or glial markers of 3 oRG cell clones after 50 days in vitro. Bar chart represents quantification of the average clone size of oRG cells. See also Figure S6.