
Fig. 4.
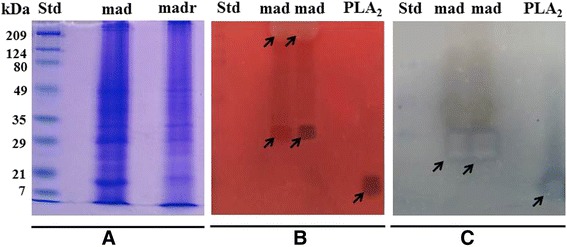
a Electrophoretic profile under non-reducing (Mad) and reducing (Madr) conditions. The protein bands were visualized by the Coomassie blue staining method. b Hemolysis zymogram on a 1.5 % agar gel supplemented with 5 % egg yolk and 3 % of washed erythrocytes, two hemolytic zones were observed in the gel corresponding to ~28-30 and ~200 kDa. c PLA2 zymogram on a 2 % agarose gel supplemented with 6 % egg yolk showed only one zone with enzymatic activity corresponding to ~28-30 kDa