
Fig. 1.
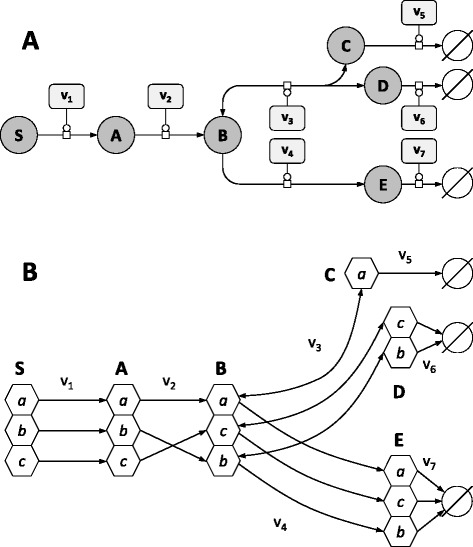
A simple example network. a Representation of the example network in Systems Biology Graphical Notation format (SBGN, www.sbgn.org) [47]. Rounded rectangles represent enzymes, circles represent metabolites, and circles with dark bands along their bottoms represent metabolites which appear multiple times in the map. The concentration and labeling state of S are fixed, and reactions v 5–7 represent sink reactions. b Carbon transition network used to construct the isotopomers balances, where hexagons represent carbon positions. While v 1 and v 4 do not modify the carbon skeleton between substrates and products, other reactions result in carbon inversion (v 2) or in the reversible cleavage of carbon-carbon bonds (v 3)