
Fig. 2.
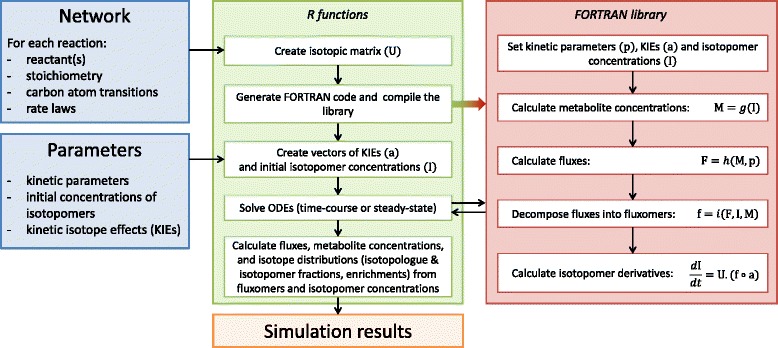
Diagram of the procedure developed to simulate the system-level impact of KIEs on metabolism. Blue boxes represent the input (definition of the metabolic system investigated and of its parameters), green and red boxes represent the steps implemented in R and FORTRAN, respectively, and orange box represents the output (simulation results). R is used to i) construct isotopic matrices, ii) create the FORTRAN library which contains the ODEs system, iii) initialize parameters, iv) solve ODEs and v) gather the results. Briefly, the FORTRAN library performs the following steps: i) computes metabolite concentrations (M) by summing isotopomer concentrations (I), function g, ii) calculates fluxes from metabolite concentrations (M) and kinetic parameters (p), function h, iii) decomposes fluxes (F) into fluxomers (f) using concentrations of isotopomers (I) and metabolites (M), function i, and iv) isotopomers derivatives are finally calculated from the isotopic matrix (U) and the fluxomers (f) and KIEs (a) vectors (Eq. 15)