
Fig. 3.
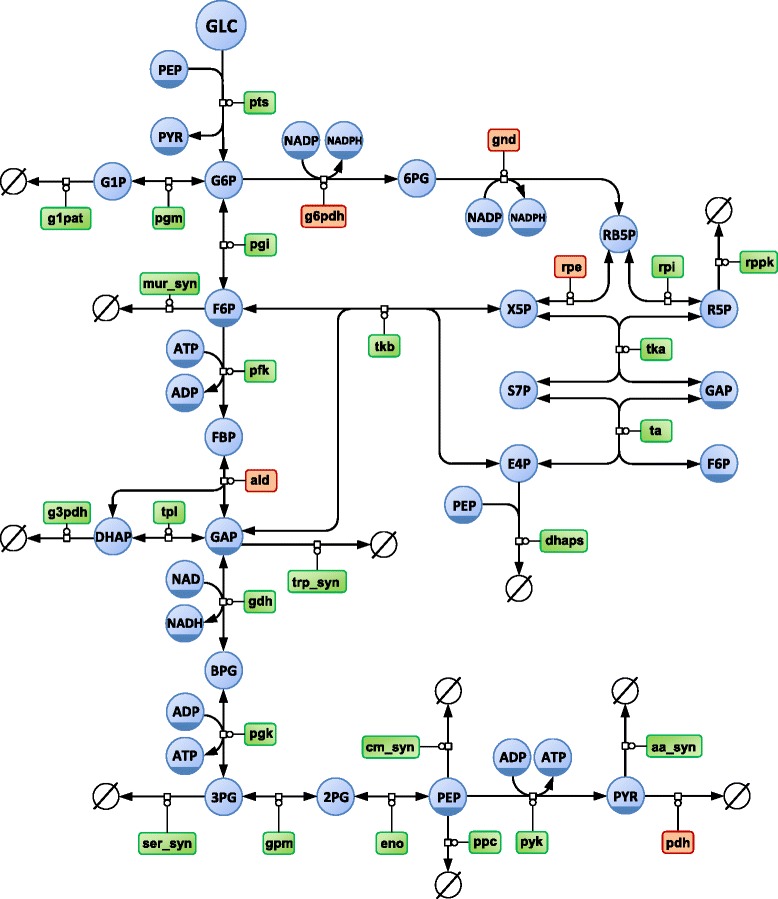
Central carbon metabolic network of Escherichia coli. Representation of the glucose uptake, glycolytic and pentose phosphate pathways of E. coli in SBGN format. Circles represent metabolites and rounded rectangles represent enzymes. Enzymes subjected to kinetic isotope effects are highlighted in orange. Note that the 17 reactions of dilution of intracellular pools due to growth are omitted from this diagram for clarity of the layout