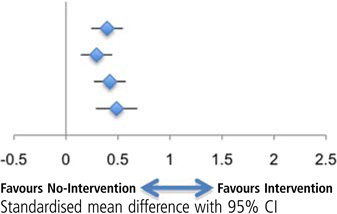
Table 5.
Healthcare providers, pre–post intervention studies
| Outcome | Sample size |
Number of studies Total |
Study quality (mean score*) |
Heterogeneity |
||
|---|---|---|---|---|---|---|
| Q | p | |||||
| Provider burnout |  |
|||||
| Emotional exhaustion | 179 | 3 | 11.3 | 0.56 | 0.91 | |
| Depersonalisation | 179 | 3 | 11.3 | 3.02 | 0.39 | |
| Personal accomplishment | 179 | 3 | 11.3 | 2.26 | 0.52 | |
| Stress | 79 | 3 | 10.7 | 1.51 | 0.47 | |
| QOL—mental | 93 | 1 | 14 | |||
| QOL—physical | 93 | 1 | 14 | – | – | |
| Depression | 70 | 1 | 16 | – | – | |
| Anxiety | 11 | 1 | 11 | |||
| Empathy | 70 | 1 | 16 | – | – | |
| Patient Safety Events | 16 | 1 | 10 | – | – | |
Mean Downs and Black quality score.13
–=Insufficient data.
