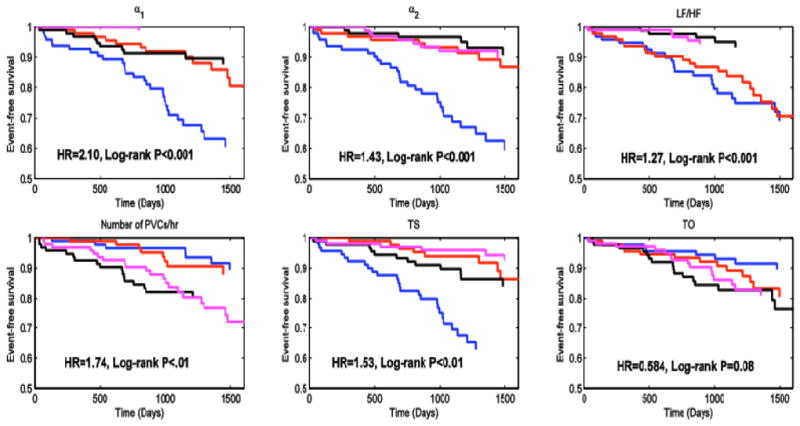
Figure 2.

Kaplan-Meier Survival Plots for occurrences of VF, VFL or SCD by quartiles of the six predictor variables. Q1 is blue, Q2 is red, Q3 is black and Q4 is magenta. Log-rank P values were obtained from comparing the survival functions of Q1 and Q2 versus the survival functions of Q3 and Q4.
