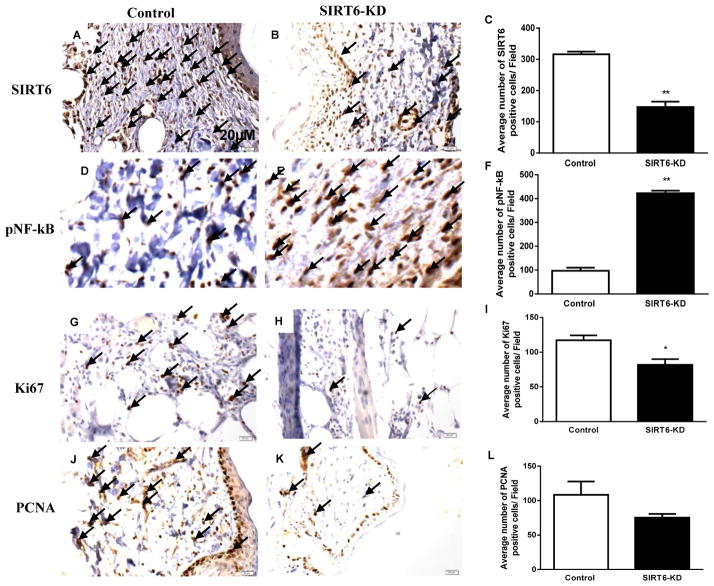
Fig 2. SIRT6, NF-kB and proliferation markers expression in diabetic wounds with SIRT6-deficiency.
(A–B) Immunohistochemical staining for SIRT6 demonstrate reduced expression of SIRT6 within SIRT6-KD wound beds compared with nonsense-treated wounds at postwounding day 14. (C) Bar graph showing the number of SIRT6 positive cells (20 fields) in SIRT6-KD and control diabetic wounds. (D–E) Immunohistochemical staining of p-NF-kB showed increased expression of p-NF-kB positive cells in the SIRT6-KD treated diabetic wounds compared to non sense treated. (F) Bar graph showing number of p-NF-kB positive cells in SIRT6-KD and control diabetic wounds. (G–H) Immunohistochemical staining for Ki67 demonstrate reduced expression of Ki67 within SIRT6-KD wound beds compared with nonsense-treated wounds at postwounding day 14. (I) Bar graph showing the number of Ki67 positive cells (20 fields) in SIRT6-KD and control diabetic wounds. (J–K) Immunohistochemical staining of PCNA shows reduced expression of PCNA positive cells in the SIRT6-KD treated diabetic wounds compared to non sense treated. (L) Bar graph showing number of PCNA positive cells in SIRT6-KD and control diabetic wounds. Representative results from three independent experiments with three-four animals in each group are shown. Values are means ± SEM. *p; **p < 0.01 vs Control.

