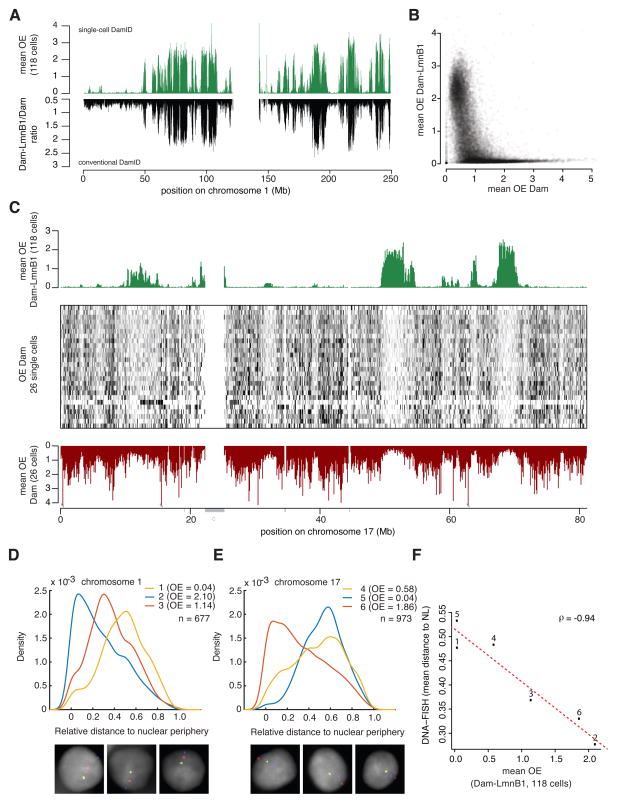
Figure 2. Validation of single-cell DamID maps.
A) Comparison NL contact map for chr1 representing the average of 118 single-cell profiles (top profile) and a conventional DamID map generated with a population of ≈ 1–2x10⁵ cells (bottom profile). Genome-wide Spearman’s ρ = 0.90 between the two methods. (B) Average OE score of 118 single-cell Dam-LmnB1 samples (y-axis) versus the average OE score of 26 single-cell Dam-only samples (x-axis). (C) Comparison of average OE scores obtained with Dam-LmnB1 (top track, average of 118 cells, same as in Figure 1B) and Dam-only (bottom track, average of 26 cells). OE scores for the individual Dam-only cells are shown as grey-scale encoded rows in the center frame. Grey bars underneath the bottom axis mark unmappable regions; “c” is centromeric region. (D–F) Multi-color 3D DNA FISH microscopy with probes for six genomic loci covering a broad range of average OE scores distributed on chr1 (n=677) (D) and chr17 (n=973) (E). Graphs depict the distributions of radial probe positions, with 0 corresponding to the nuclear edge and 1 to the centroid. Three representative nuclei with three-color FISH signals are displayed below the graphs; DNA staining with DAPI is shown in grey. (F) Mean radial positions of the six probes versus the mean DamID OE scores. Numbers 1–6 correspond to probe numbers in (D–E). Dotted line shows linear regression fit.

