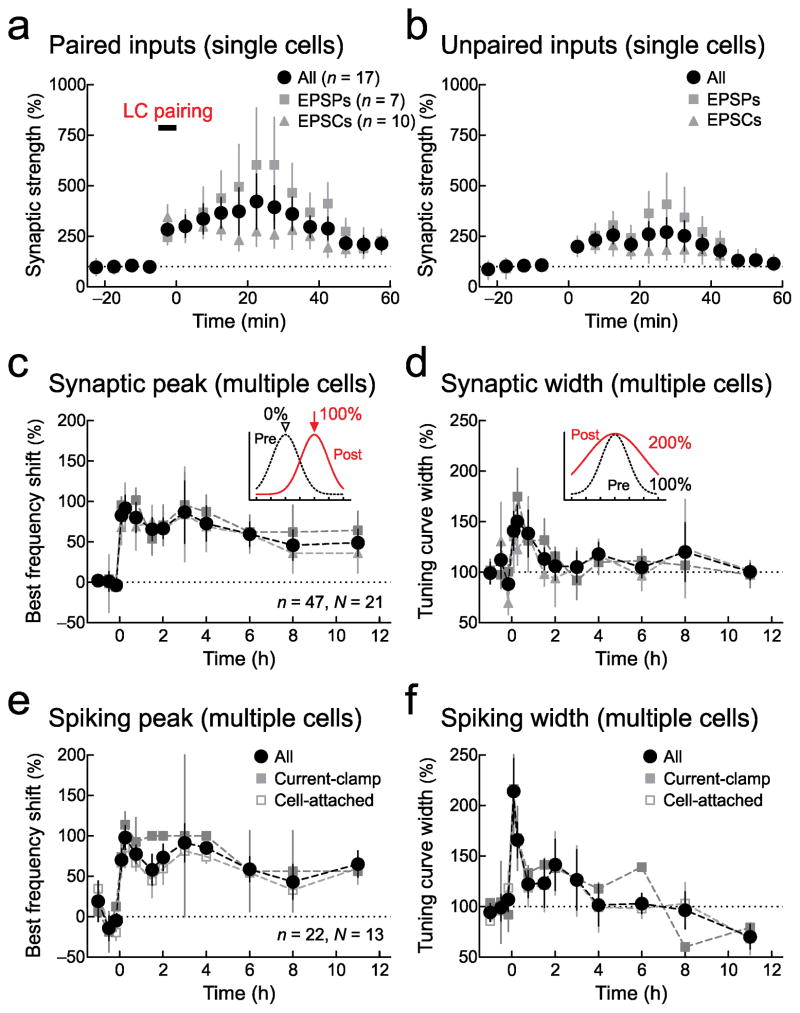
Figure 4.
Changes to synaptic and spiking tuning curves after locus coeruleus pairing. a, Changes to paired inputs from individual recordings. Circles, all recordings (5–10 minutes: 335.9±74.8%, n=37 neurons, P=0.0003; 45–60 minutes: 261.2±62.8%, n=17, P=0.01); squares, current-clamp (n=21); triangles, voltage-clamp (n=16). b, Changes to unpaired inputs from individual recordings for all recordings (5–10 minutes: 231.1±38.3%, P=0.03; 45–60 minutes: 151.0±49.4%, P=0.2). c, Best frequency shift of synaptic tuning over multiple recordings (circles, n=87 neurons, N=37 animals; 5–30 minutes: 90.6±10.7%, P=10−9; 7–12 hours: 65.6±12.5%, n=27, N=13, p<P=0.0002; squares, current-clamp, n=47; triangles, voltage-clamp, n=40). d, Synaptic tuning curve width over multiple recordings (5–30 minutes: 146.6±14.8%, n=37, N=37, P=10−40.; 7–12 hours: 103.3±7.8%, n=27, N=13, P=0.1). Same recordings as c. e, Best frequency shifts of spiking tuning curves over multiple recordings (circles, n=72, N=34; 5–30 minutes: 89.7±11.4%, n=29, N=29, P=10−5; 7–12 hours: 66.1±11.5%, n=21, N=11, P=0.002; filled squares, current-clamp, n=22; open squares, cell-attached, n=50). f, Widening of spiking tuning curves over multiple recordings (5–30 minutes: 188.5±15.1%, n=29, N=29, P=0.001; 7–12 hours: 93.6±11.5%, n=21, N=11, P=0.7). Same recordings as e. All comparisons with Student’s paired two-tailed t-tests. Error bars indicate s.e.m.

