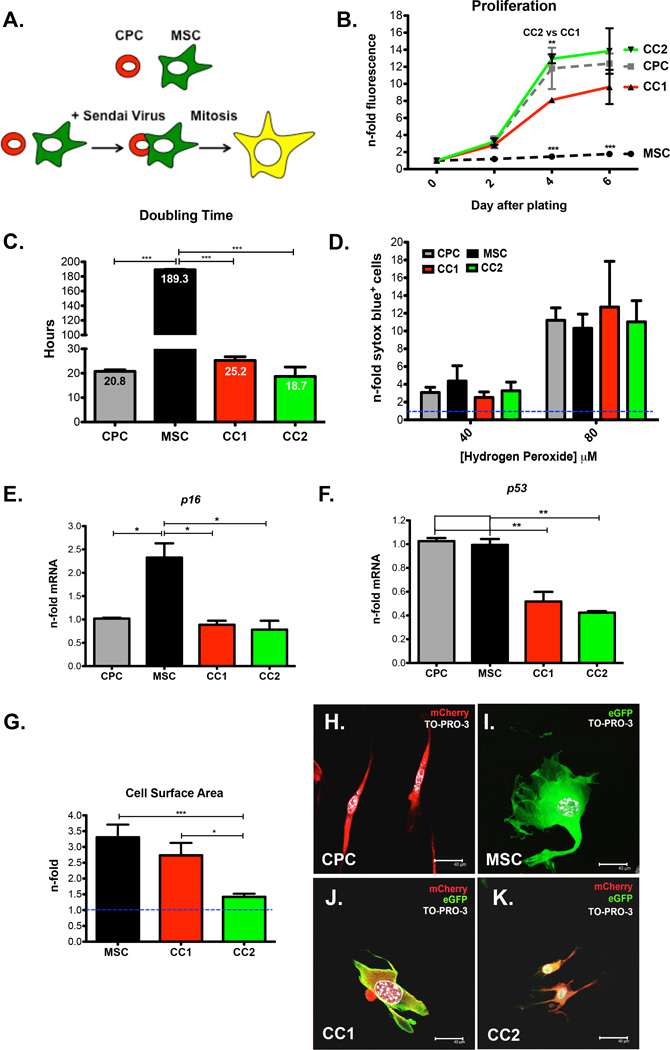
Figure 1. Phenotypic Characterization of CardioChimeras.
(A) Schematic representation of the creation of CardioChimeras. (B) Proliferation of CCs, CPCs and MSCs represented as a fold change relative to day of plating. (C) Cell doubling time in hours. (D) Cell death assay of CCs and parents cells after treatment with 40µM or 80µM hydrogen peroxide represented as a fold change relative to cells not treated with hydrogen peroxide. (E) p16 and (F) p53 gene expression normalized to ribosomal 18s and represented as a fold change relative to CPCs. (G) Cell surface area represented as a fold change normalized to CPCs (blue dashed line, 1.0). Fluorescent images of (H) CPCs, (I) MSCs, (J) CC1 or (K) CC2. * p<0.05, ** p<0.01, *** p<0.001. Scale bar is 40µm.

