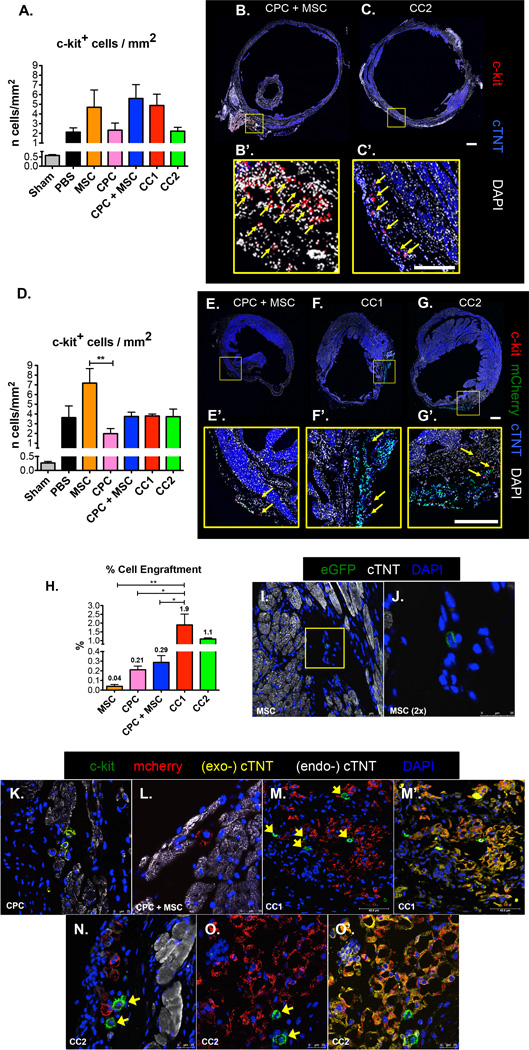
Figure 4. CardioChimeras have increased engraftment, expression of cardiomyogenic markers and support the increased presence of c-kit+ cells in the myocardium 12 weeks after damage.
(A) Number of c-kit+ cells over the area of left ventricular free wall (mm2) in a 4-week damaged heart. Representative whole heart scans of (B) CPC + MSC and (C) CC2 treated hearts to visualize c-kit+ cells (red). Scale bar is 100µm. (B’) and (C’) C-kit+ cells are identified by yellow arrows. Scale bar is 50µm. (D) Number of c-kit+ cells in 12-week damaged heart.. Representative whole heart scans of (E) CPC + MSC, (F) CC1 and (G) CC2 treated hearts to visualize exogenous mcherry+ cells (green) and c-kit+ cells (red). Scale bar is 100µm. (E’), (F’) and (G’) C-kit+ cells are identified by yellow arrows. Scale bar is 100µm. (H) Cell engraftment efficiency (%). (I) MSC detected by GFP fluorescence at 12 weeks. (J) 2× zoom of a MSC in the border zone area. (K) C-kit+ /mcherry+ CPCs in the border zone area. (L) Mcherry+ CPC in CPC + MSC treated heart. (M) Mcherry+ CC1 visualized in the infarcted area surrounded by c-kit+ cells (green). (M’) Overlay of cTNT (exogenous-cTNT, yellow) in CC1 mcherry labeled cells. (N) Mcherry+ CC2 visualized in the infarcted area surrounded by c-kit+ cells (green). (O) Mcherry+ CC2 (red) visualized in the infarcted area surrounded by c-kit+ cells (green). (O) Overlay of cTNT (exogenous-cTNT, yellow) in CC2 mcherry labeled cells. Endogenous-cTNT (white) labels existing cardiac myocytes. Sample size of 3 mice per group. * p<0.05, ** p<0.01, *** p<0.001.

