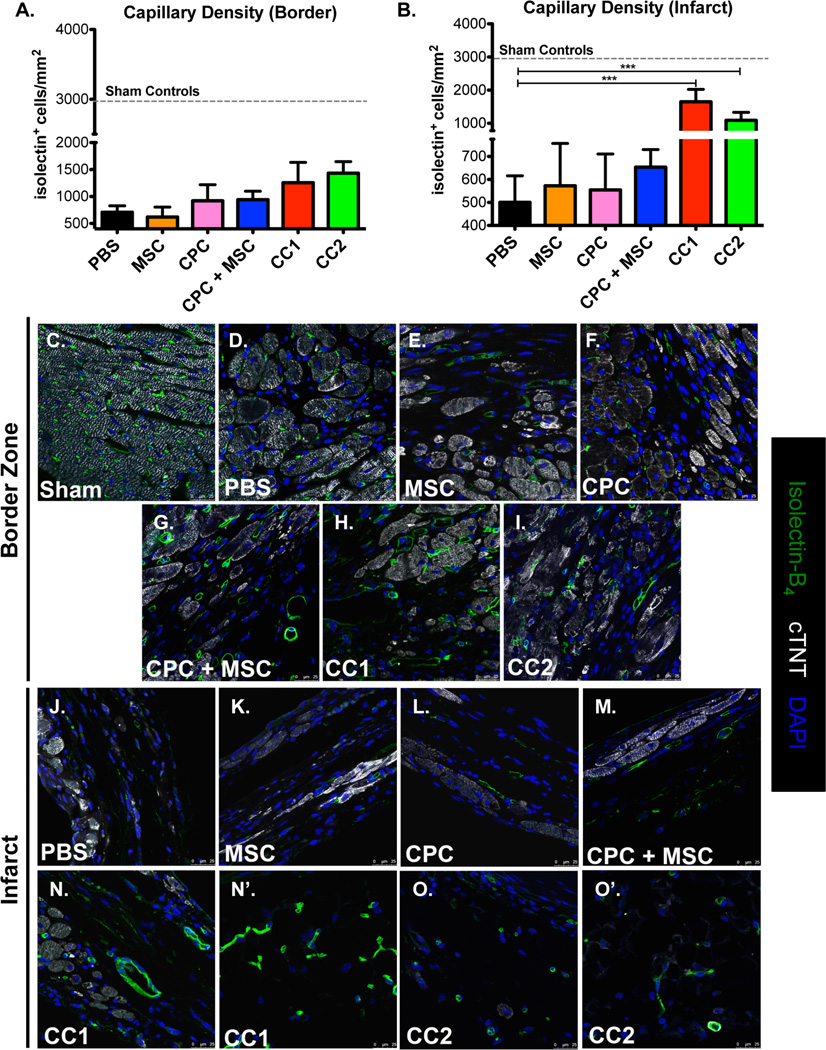
Figure 5. CardioChimeras increase capillary density in the infarct area.
(A) Capillary density in the border zone and (B) Infarcted heart regions. Sample sizes are 3–4 mice per group. Sham controls (dashed line) are represented as control for baseline density of isolectin+ structures per mm2. (C–I) Representative border zone images to visualize isolectin+ structures. (J–O) Representative infarct zone images to visualize and quantitate isolectin+ structures. Green= Isolectin B4, White=cardiac troponin T and Blue= DAPI to stain for nuclei. Scale bar is 25µm.* p<0.05, ** p<0.01, *** p<0.001.

