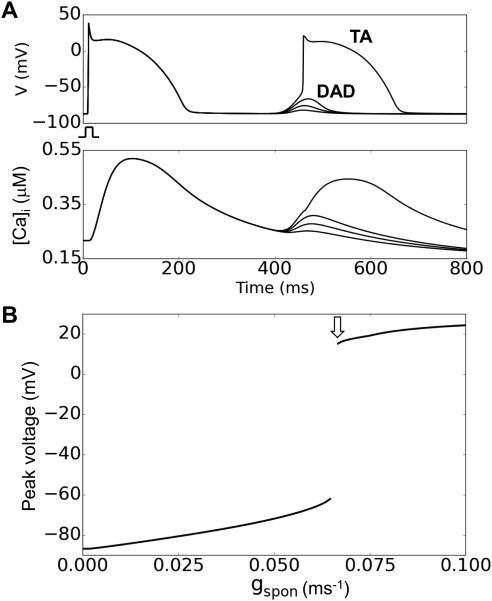
Figure 1. The DAD model.
A. DADs and TA from a single isolated cell for different gspon values. Upper traces show membrane potential and lower traces show the corresponding intracellular Ca concentrations. B. Maximum DAD voltage amplitude versus gspon. The arrow indicates the gspon threshold for a suprathreshold DAD eliciting TA.

