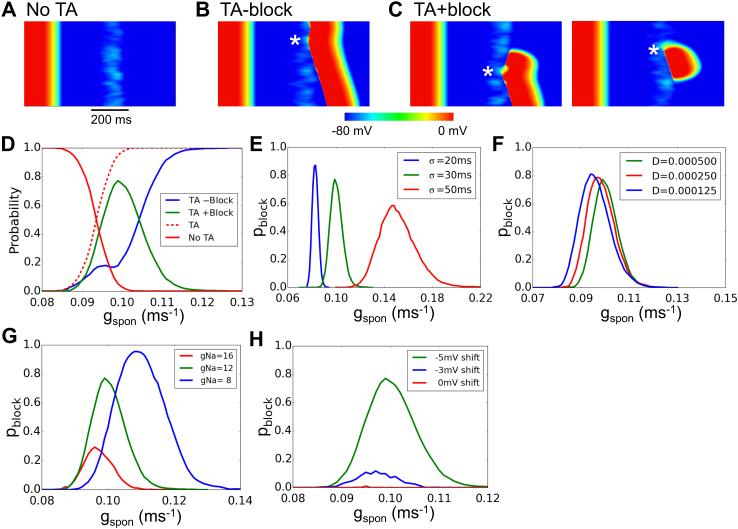
Figure 4. Complex excitation patterns in a 1D cable.
A-C. Space-time plots of membrane potential versus time in a 300 cell cable in which all cells exhibited DADs with randomly assigned latencies (σ=50 ms) following a paced AP. gspon=0.15 ms−1. D. Probability of no TA (red), a successfully propagating TA (blue) and a TA with conduction block (green) versus gspon for σ=30 ms. Arrow indicates the gspon threshold for TA. E. Probability of conduction block versus gspon for different σ. F. Probability of conduction block versus gspon for different diffusion coefficients (D) reflecting gap junction coupling. G. Probability of conduction block versus gspon for different gNa. H. Probability of conduction block versus gspon for shifts in the half-maximal voltage of h∞. The cable length in D-H was 450 cells. The probability of each parameter point was calculated from 1,000 random trials. The green curve in D-H is the control case with σ=30 ms, D=0.0005 cm2/ms, gNa=12 pA/pF, and a −5 mV shift of h∞.

