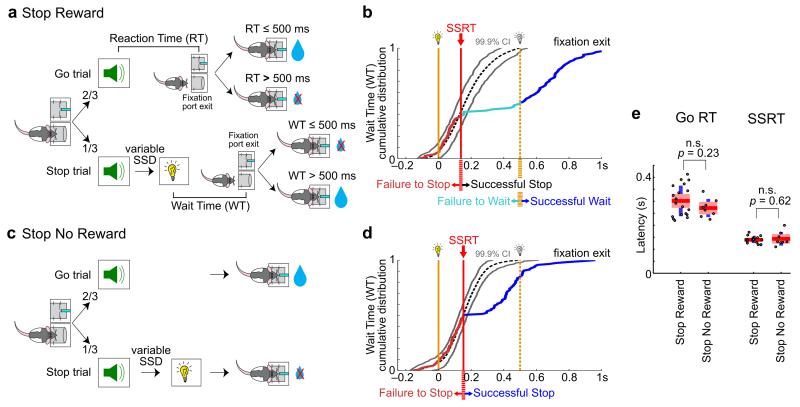
Figure 1. Similar rapid behavioral stopping regardless of whether successful stopping is rewarded.
(a, c) Schematic of the Stop Reward Task (a) and Stop No Reward Task (c). In the Stop Reward Task, each trial was initiated by the rat entering the fixation port, followed by the same go sound in all trials signaling reward in the adjacent port if reaction time (RT) was ≤ 500ms. On stop trials, the go sound was followed by a stop light after a variable stop signal delay (SSD). Rats were rewarded on these trials if they canceled the go response and the wait time (WT, response latency relative to stop signal onset) was > 500ms. The Stop No Reward Task had the same sequence of events, except that stop trials were never rewarded. (b, d) Example sessions from the Stop Reward Task (b) and the Stop No Reward Task (d) showing cumulative distributions of WT. Yellow dashed lines indicate the offset of the stop signal and the end of the waiting period. SSRT was determined by comparing the cumulative WT distribution in stop trials with latency-matched go trials (gray lines indicate 99.9% confidence interval) (see Methods for details). Fixation port exits before SSRT were classified as failure-to-stop trials while those after SSRT were classified as successful stop trials. Successful stop trials in the Stop Reward Task were further classified into failure-to-wait and successful wait trials depending on whether rats waited long enough to receive reward. (e) Go RT and SSRT were not significantly different between the two SST variants. Individual animals (points) are plotted along with group mean (red), ± 1.96 s.e.m. (red shaded area) and ± 1 s.d. (blue) (Stop Reward: n = 19 rats, 543 sessions; Stop No Reward: n = 8 rats, 466 sessions).

