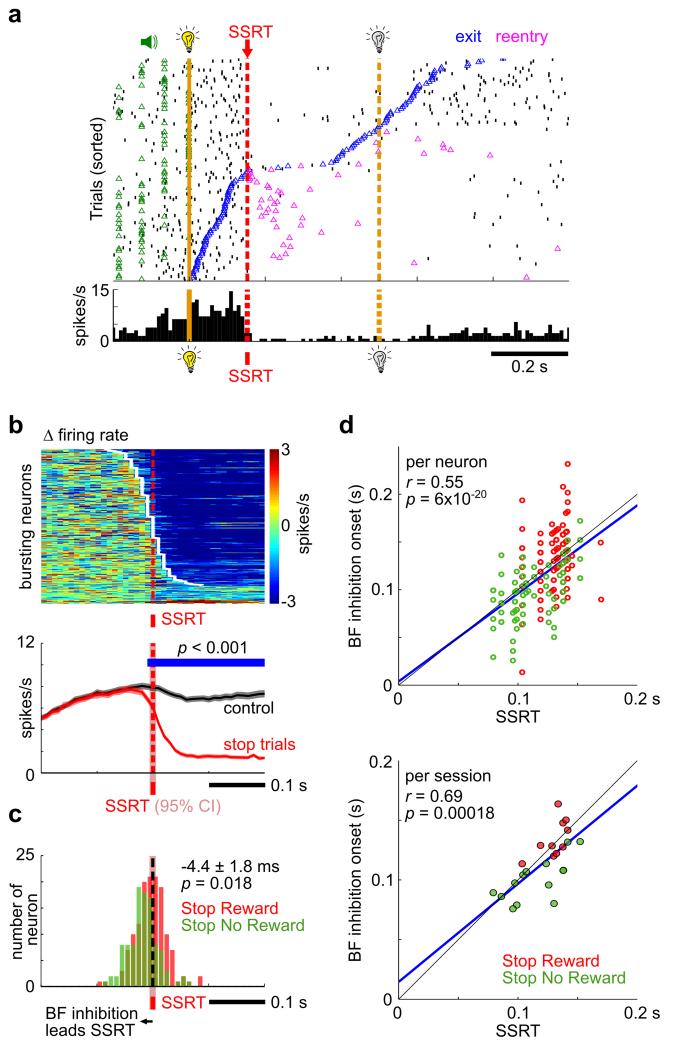
Figure 3. The latency of BF neuronal inhibition was coupled with and slightly preceded SSRT, irrespective of whether successful stopping was rewarded.
(a) Raster plot of an example BF bursting neuron in the Stop Reward Task. Stop trials were aligned to stop signal onset and sorted by fixation port exit time. Near complete neuronal inhibition began around SSRT. (b) Response of BF bursting neurons to the stop signal, aligned at the estimated SSRT within each session. Top, BF bursting neurons (n=275 neurons) were sorted based on the latency of neuronal inhibition (white line). Bottom, the population PSTH shows that the onset of BF inhibition preceded SSRT by at least 10ms. (c) Histogram of neuronal inhibition latency for BF bursting neurons in the Stop Reward Task (n=138) and Stop No Reward Task (n=104) relative to SSRT. The red shaded areas around SSRT in (b) and (c) reflect the 95% confidence interval of the mean SSRT estimate (n=37 sessions) (see Methods for details). (d) Strong correlation between SSRT and the onset of neuronal inhibition for individual BF bursting neurons (top) and for sessions with at least 4 BF bursting neurons (bottom, n=24 sessions). The blue line is the linear regression fit.

