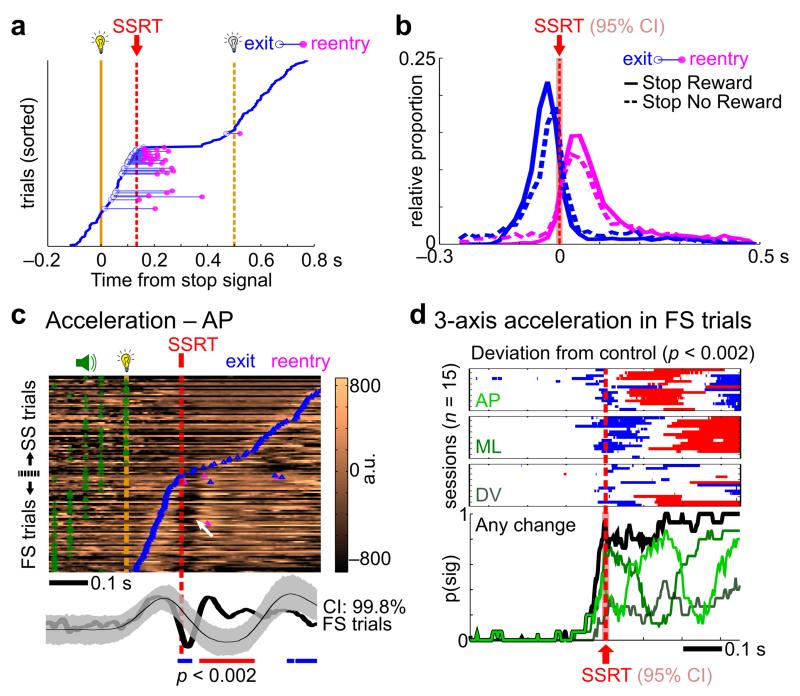
Figure 6. BF neuronal inhibition in failure-to-stop trials was associated with corrective fixation port reentries and reversal of head movements at SSRT.
(a) An example session from the Stop Reward Task showing frequent fixation port reentry events in failure-to-stop trials, especially when rats exited the fixation port just before SSRT. (b) The distribution of fixation port exit and reentry events in all reentry trials. For both SST variants, fixation port exit and reentry events were most common just before and after SSRT, respectively. (c) Head-mounted accelerometer signal from an example session in the Stop No Reward Task. The top panel shows color-coded accelerometer signals in single trials, with prominent reversal of movement acceleration in failure-to-stop trials occurring at SSRT (white arrow). The bottom panel shows the averages of accelerometer signals from failure-to-stop trials (black) and matching go trial controls (gray areas indicate the CI, see Methods for details). Horizontal bars indicate significant (p<0.002) decreases (blue) or increases (red) in accelerometer signals in failure-to-stop trials. (d) The time course of when accelerometer signals in failure-to-stop trials were significantly different from matching go trial controls. Significant bins were plotted separately for the 3 accelerometer axes in 15 sessions, with the aggregate probabilities shown below. Significant differences in accelerometer signals in failure-to-stop trials began at SSRT. The red shaded areas indicate the 95% CI of SSRT estimate (n=15 sessions).

