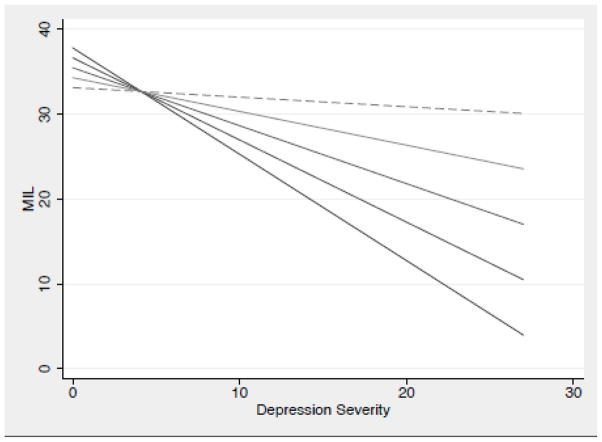
Figure 1.
Simple slope analyses depicting the interaction of depressive symptom severity and spirituality on meaning in life
Note. Lines represent spirituality, with the top line representing the highest level of spirituality (STI = 48) and subsequent lines representing lower levels of spirituality in 10 point intervals (48, 38, …). Solid lines indicate statistically significant simple slopes, while dashed lines indicate non-significant simple slopes.

