
Figure 9.
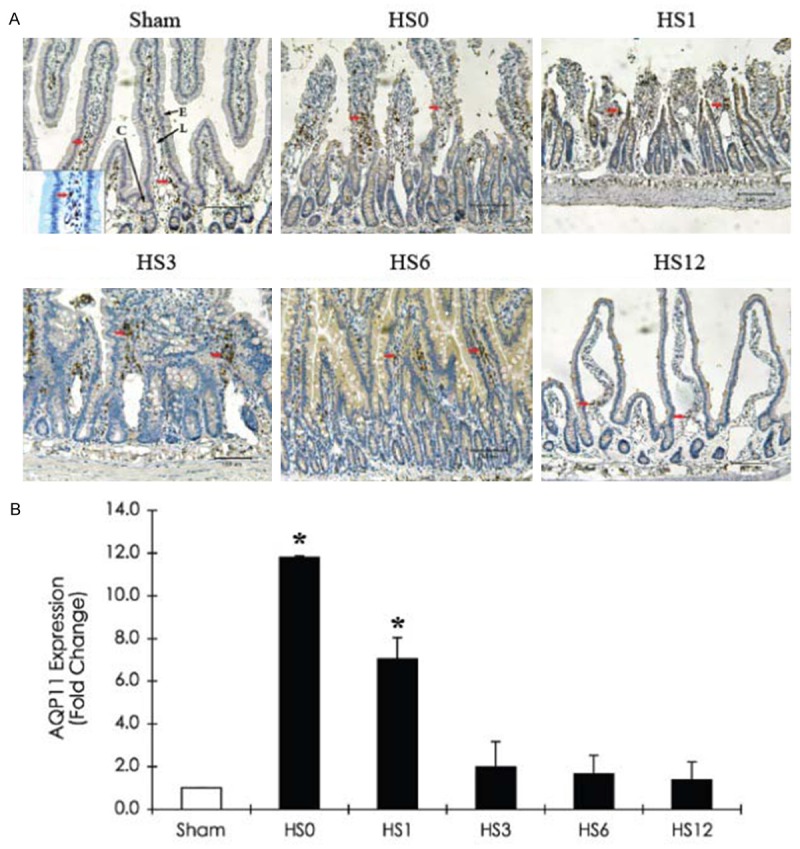
Immunohistochemical staining of AQP11 expression in the jejunum of a sham rat and HS-treated rats (sacrificed at predetermined periods: HS0, HS1, HS3, HS6, and HS12) A. Representative immunohistostaining photographs of AQP11 expression. Red arrows indicate positive AQP11 cells. Scale bar: 100 μm. L: Lacteal; C: Crypt; E: Intestinal epithelium; V: Vessel. B. Quantification of AQP11 expression obtained from 10 images at ×100 magnification (n = 5). *compared with sham, P < 0.05.