
Figure 6.
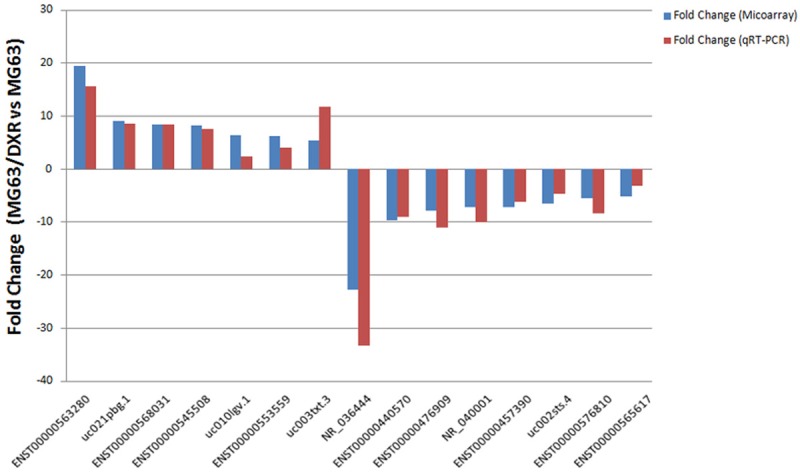
The differential expression of lncRNAs was validated by quantitative real-time PCR. Comparison between microarray and quantitative real-time PCR results. Fifteen differentially expressed lncRNAs (seven up-regulated and eight down-regulated) were validated by qRT-PCR and the results were shown in the histogram. The heights of the columns in the chart represent the median fold-changes (MG63/DXR vs. MG63) in expression across three pairs of samples (P≤0.05). The qPCR results were consistent with the microarray data.