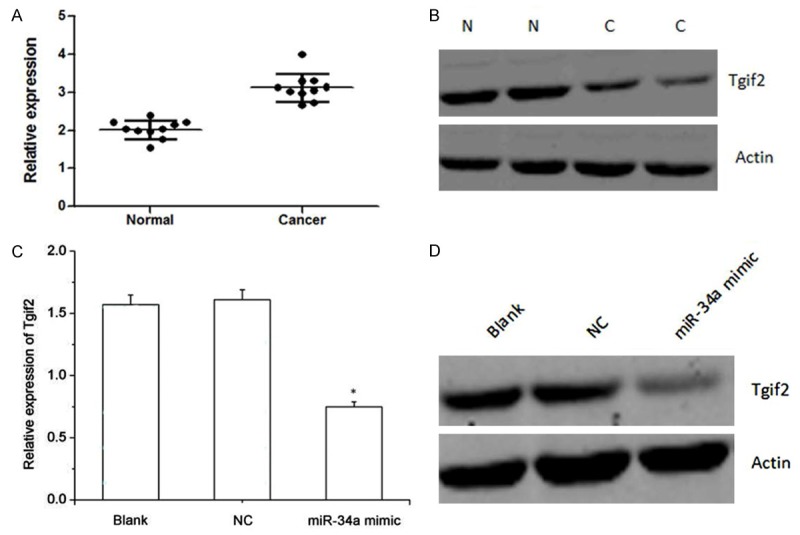
Figure 2.

A, B. The relative expression level of Tgif2 in gastric cancer tissues and the adjacent non-tumor tissues. A: Real-time PCR; B: Western blot analysis. N: Normal; C: Cancer. C, D. The relative expression of Tgif2 in gastric cancer transfected with miR-34a mimic and the controls after transfection with miR-34a mimic. C: Real-time PCR; D: Western blot analysis. NC: Normal cancer.
