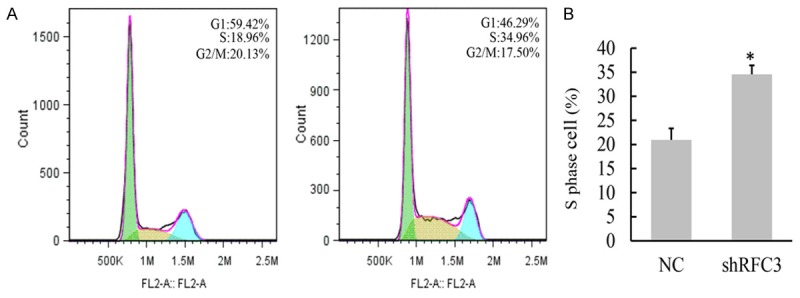
Figure 4.

Knock-down of RFC3 arrested cell cycle in the S-phase. A. Cell cycle distribution in OVCAR-3 cells (left) and shRFC3 OVCAR-3 cells (right) were shown as analyzed by FACS. B. The percentage of OVCAR-3 cells in S phase was significantly higher in shRFC3 cells than that in control cells, indicating a block of DNA replication. Data were presented data were presented as means ± SD analyzed with AVOVA from three independent experiments. *: P < 0.05.
