
Figure 3.
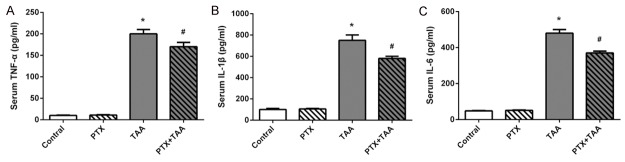
Serum levels of TNF-α, IL-1β, and IL-6 in different groups. Levels are displayed on different groups exposed to PTX and/or TAA administration. Control rats receiving normal diet and water. All values refer to mean ± standard deviation (SD). A. TNF-α. B. IL-1β. C. IL-6. *P<0.01 as compared with control group. #P<0.01 as compared with TAA group.