
Figure 5.
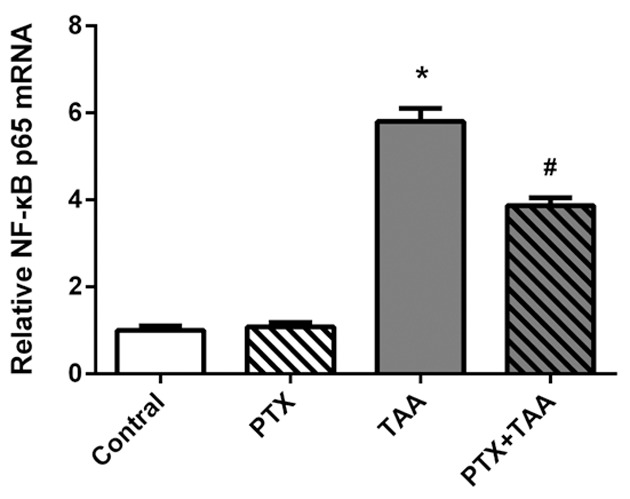
The expressions of mRNA for NF-κB p65 in liver tissues by quantitative RT-PCR analysis. Levels are displayed on different groups exposed to PTX and/or TAA administration. Control rats receiving normal diet and water. The mRNA levels were normalized to β-actin. Mean values ± SD are provided. *P<0.01 as compared with control group. #P<0.01 as compared with TAA group.